DISCUSSION
Potential error
Potential error
(represented by bars in Figure 4, Figure
5, Figure 6, Figure
9, Figure 10, Figure
11) in determining extinction and origination intensities is higher for
small sample sizes than for larger samples. Standing diversity of cyclostomes
was relatively low in the Albian and in all post-Danian Cenozoic stages, and
standing diversity of cheilostomes was very low in the Albian, Cenomanian and
Turonian (Figure 2). Consequently,
error bars for these are longer than for any other stages. For
the times of lowest diversity enumerated above, any source of error such as
how completely the fossil record is known and random events in background
extinctions and originations has a proportionally greater influence on
calculated extinction and origination rates than during times of higher
diversity. Consequently, in the discussion and interpretations that follow, we
de-emphasise the earliest (Albian-Turonian) record of cheilostomes.
Extinctions
Maastrichtian/Danian. By
virtually all measures, generic extinction in the Maastrichtian was greater for
both cyclostomes and cheilostomes than in any other stage during the past 100
million years. However, it is almost equalled or even exceeded (Figure
4E, F; Figure 5E, Figure
6E, F) by bryozoan generic extinction in the Danian. Error bars for all
Maastrichtian and Danian extinction measures overlap, apart from measures of
total bryozoan and cyclostome generic extinctions per standing diversity when
stage-only genera are included (Figure 4D,
Figure 5D). The proportion of
stage-only genera for both cyclostomes (11 percent) and cheilostomes (14
percent) was much higher for the Maastrichtian than for any other stage; in the
Danian, the 3 percent cyclostome stage-only genera is at background level,
but the 9 percent cheilostome stage-only genera is much higher than the norm of
2 to 3 percent. The greater difference in stage-only genera between
Maastrichtian and Danian for cyclostomes apparently resulted in the higher
Maastrichtian than Danian extinction per standing diversity per million years
when stage-only genera were included. It also contributed to lack of overlap of
error bars for this measure for Maastrichtian and Danian cyclostomes (Figure
5D), as well as for
bryozoans as a whole (Figure
4D). Bryozoans
experienced essentially identical generic extinction intensities in the
Maastrichtian and Danian, except that the Maastrichtian extinction appears to
have been somewhat more intense than the Danian extinction for cyclostomes.
Including stage-only genera, extinctions per standing diversity were slightly
higher for cyclostomes than for cheilostomes in the Maastrichtian,
resulting in a smaller
absolute
diversity of cyclostomes relative to cheilostomes during the Danian. There was
only a slight decline in within-fauna cyclostome species richness from the
Maastrichtian into the Danian, part of a longer-term trend (Lidgard
et al. 1993). Conversely, there was an abrupt transition across the
Maastrichtian-Danian boundary from cheilostome to cyclostome dominance of
assemblage biomass as measured by relative skeletal mass (Håkansson
and Thomsen 1979, 1999;
McKinney
et al. 1998). Therefore, the generic extinction pattern stands in sharp
contrast with the abundance patterns. High
generic extinction rates of bryozoans at the end of the Cretaceous have been
noted previously by Viskova
(1980, 1997), McKinney
et al. (1998), and Sepkoski et
al. (2000). This concentration of bryozoan extinctions is consistent with a
K-T mass extinction, now generally attributed to impact of an extraterrestrial
bolide (Alvarez et al. 1980, and many papers since). However,
our data lack
the precision necessary to determine whether bryozoan extinctions occurred at
the end of the Maastrichtian rather than being distributed more widely through
that stage. The equally high bryozoan
extinction rates for the Danian must be explained by other cause(s). They
apparently correlate with the loss of carbonate shelf environments across
northern Europe, which hosted a high proportion of bryozoan taxa known in the
Danian fossil record (Håkansson
and Thomsen 1999). The widespread chalk-depositing environments were
established during the Cenomanian Stage of the mid-Cretaceous (e.g., Rawson
1992; Gale 2000; Gale
et al. 2000) and lasted through to the end of the Danian (e.g., Smith
and Jeffery 2000). Although local bryozoan diversity and abundance were
reduced essentially to zero immediately above the K-T boundary in the few
complete sections studied in detail, both abundance and diversity re-built
within a few decimetres of the base of the Danian section in northern Europe (Håkansson
and Thomsen 1979, 1999).
The subsequent disappearance of the chalk environments by the end of the Danian
and correlated bryozoan extinction may possibly be explained by (1) long-term
fall in sea-level (Haq et al. 1987)
to a level that shut off oceanic circulation onto the shelf (e.g., Gale
et al. 2000); and/or (2) development or increase of cyclonic circulation
across the opening Atlantic (Parrish
and Curtis 1982).
Background
extinctions
Background intensities of
cheilostome extinctions, calculated as extinctions per million years (Figure
6A, B), are similar for the Upper Cretaceous and Cenozoic, whereas
Maastrichtian and Danian extinction rates are substantially greater (although
their error bars overlap appreciably with those of several other stages).
However, Maastrichtian and notably Danian extinction rates group with the highly
variable earlier Cretaceous extinctions in plots of extinctions per standing
diversity (Figure 6C, D) and also with
extinctions per standing diversity per million years (Figure
6E, F). In contrast, for cyclostomes the measures of extinction rate are
much lower for virtually all other stages than for the Maastrichtian and Danian,
especially extinctions per standing diversity (Figure
5C, D). The low pre-Maastrichtian and post-Danian extinction rates likely
are a good reflection of background extinction, which are more constant over
time than are origination rates (e.g. Van
Valen 1985; Gilinsky and
Bambach 1987). 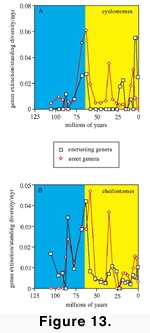 Extinction
rates of cheilostomes and cyclostomes during the past 100 myr have been
remarkably similar, with a median (background) E/D/myr of 0.009 for
cyclostomes and 0.013 for cheilostomes. An arithmetic plot of cyclostome versus
cheilostome extinction rates (Figure 13A)
shows low correlation (r = 0.487) if all Upper Cretaceous and Cenozoic stages
are considered together. However, if stages are separated into the two major
time intervals, low correlation (r = 0.429) is seen for paired Upper Cretaceous
extinction rates, but Cenozoic extinction rates correlate well with one another
(r = 0.742). The poor correlation in the Upper Cretaceous is due largely to high
variation in extinction rate of low-diversity, pre-Campanian cheilostomes, but
not of cyclostomes. Sepkoski
et al. (2000) determined background extinction rates for cyclostomes and
cheilostomes by counting frequency of longevity of genera, grouping them into
bins of 5-million-year multiples, and taking the slope of log-linear
regression for bins other than the shortest (0 to 5 million years). Their
estimates were 0.31 genus/genus-million years for cyclostomes and 0.48
genus/genus-million years for cheilostomes. Background extinction rate of
cyclostomes by their calculations is, therefore, 65 percent that of cheilostomes.
Our results (previous paragraph) for background extinction rate calculated in a
very different wayextinctions per standing diversity per million yearsis
remarkably similar: cyclostome extinction rate is 69 percent that of
cheilostomes.
Extinction
rates of cheilostomes and cyclostomes during the past 100 myr have been
remarkably similar, with a median (background) E/D/myr of 0.009 for
cyclostomes and 0.013 for cheilostomes. An arithmetic plot of cyclostome versus
cheilostome extinction rates (Figure 13A)
shows low correlation (r = 0.487) if all Upper Cretaceous and Cenozoic stages
are considered together. However, if stages are separated into the two major
time intervals, low correlation (r = 0.429) is seen for paired Upper Cretaceous
extinction rates, but Cenozoic extinction rates correlate well with one another
(r = 0.742). The poor correlation in the Upper Cretaceous is due largely to high
variation in extinction rate of low-diversity, pre-Campanian cheilostomes, but
not of cyclostomes. Sepkoski
et al. (2000) determined background extinction rates for cyclostomes and
cheilostomes by counting frequency of longevity of genera, grouping them into
bins of 5-million-year multiples, and taking the slope of log-linear
regression for bins other than the shortest (0 to 5 million years). Their
estimates were 0.31 genus/genus-million years for cyclostomes and 0.48
genus/genus-million years for cheilostomes. Background extinction rate of
cyclostomes by their calculations is, therefore, 65 percent that of cheilostomes.
Our results (previous paragraph) for background extinction rate calculated in a
very different wayextinctions per standing diversity per million yearsis
remarkably similar: cyclostome extinction rate is 69 percent that of
cheilostomes.
Priabonian
Among post-Danian
cheilostome and cyclostome extinction rates, the Priabonian (latest Eocene)
stands anomalously high in all measures except for cheilostome extinctions per
standing diversity inclusive of stage-only genera. This is probably part of the
widely recognised Eocene/Oligocene extinction associated with the world change
from greenhouse to icehouse conditions (Prothero
1994). We cannot resolve extinction rates in bryozoans to zone as has been
done for some other taxa affected during the mid- to late Eocene extinction.
However, the extinction of bryozoans appears different from the detailed
extinction patterns documented for coccolithophores (Aubrey
1992) and foraminiferans (Boersma
et al. 1987). While extinction patterns for these groups are collectively
complex, their respective times and places of most profound extinction and
displacement occurred either early or late in the middle Eocene and can be
related to successive stages in the long-term cooling. Eocene extinction of
echinoids also occurred in multiple phases, with the maximum diversity in the
Lutetian, followed by moderate extinction at the Lutetian/Bartonian boundary and
maximum extinction during the Priabonian (M.
L. McKinney et al. 1992). However, extinction rates of bryozoans in the
early to middle Eocene (Ypresian Bartonian) were not above background levels
but instead were intense during the Priabonian at a time when extinction rates
of other taxa were declining. A possible reason for this delayed extinction of
bryozoans during an extended period of global cooling is that their peak
abundance occurs in shelf-depth temperate rather than tropical waters (Taylor
and Allison 1998). The organisms that had been affected in the earlier phase
of the extended Eocene extinction were predominantly tropical and deep-water.
Neogene
Cyclostome extinction rates
seem to increase through the Miocene and Pliocene, culminating in a late
Pliocene peak. This apparent increase in cyclostome extinctions through the
Neogene, if real, finds a parallel in coral and mollusc extinctions documented
in the western Atlantic and Caribbean (Stanley
and Campbell 1981; Petuch 1995;
Allmon et al. 1996; Jackson
et al. 1993; Budd et al. 1996; Jackson
and Johnson 2000). These extinctions have been attributed to a variety of
environmental causes related to the closure of the Isthmus of Panama and
long-distance effects of intensified glaciation.
Growth habits
A broad range of colony
growth habits has developed in both cyclostomes and cheilostomes (Lagaaij
and Gautier 1965; McKinney
and Jackson 1989; Hageman et al.
1998), most of which can be categorised as either encrusting or erect (a
minority are free-living or have morphologies that are difficult to place, and
these are not considered here). As a first step towards analysis of the
ecological history of bryozoan extinctions, we examined the extinction rate of
encrusting and erect genera over the past 100 million years. Some genera include
both encrusting and erect colonies, and we assigned a value of 0.5 for each such
genus to the tally for encrusters and also for erect forms. 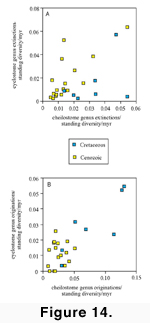 The
most notable patterns for cyclostomes (Figure
14A) are that (1) erect forms went extinct at twice the rate of encrusters
during both the Maastrichtian and Danian; and (2) the Priabonian extinction
eliminated only erect genera. Indeed the Priabonian cyclostome extinction can be
viewed as an intensification of the pattern seen for the Thanetian through
Chattian (i.e., almost the entire Palaeogene) during which no encrusting
cyclostomes are known to have gone extinct. The absence of encrusting cyclostome
extinctions during the post-Danian Palaeogene and its concentration in the
Neogene may, however, be a taxonomic artefact given that encrusting cyclostome
genera are poorly defined. Extinction rates of
encrusting and erect cheilostomes were similar during the Maastrichtian and
Danian (Figure 14B), followed by
disproportionally higher periods of extinctions of erect cheilostomes during the
Thanetian and the Priabonian; at other times, encrusting and erect cheilostomes
exhibited similar patterns of extinction rate. The substantial Palaeogene to
Neogene decline in erect species from approximately 50 percent to approximately
25 percent of the bryozoan fauna (McKinney
and Jackson 1989) may be due, at least in part, to the Priabonian
extinction. Our data suggest contrasting
extinction patterns of erect and encrusting cheilostome genera in the Pliocene
and Pleistocene (Figure 14B), with high
extinction rates of erect cheilostomes in the Pliocene followed by low
extinction rate in the Pleistocene, and the opposite pattern in encrusting
genera. These patterns for genera
parallel the
strong Neogene decline of erect cheilostome species in the Caribbean described
by Cheetham and Jackson (1996).
They noted that the decline in proportion of erect cheilostomes is in part due
to more vigorous speciation of encrusting species but is largely due to
preferential extinction of species in erect genera.
The
most notable patterns for cyclostomes (Figure
14A) are that (1) erect forms went extinct at twice the rate of encrusters
during both the Maastrichtian and Danian; and (2) the Priabonian extinction
eliminated only erect genera. Indeed the Priabonian cyclostome extinction can be
viewed as an intensification of the pattern seen for the Thanetian through
Chattian (i.e., almost the entire Palaeogene) during which no encrusting
cyclostomes are known to have gone extinct. The absence of encrusting cyclostome
extinctions during the post-Danian Palaeogene and its concentration in the
Neogene may, however, be a taxonomic artefact given that encrusting cyclostome
genera are poorly defined. Extinction rates of
encrusting and erect cheilostomes were similar during the Maastrichtian and
Danian (Figure 14B), followed by
disproportionally higher periods of extinctions of erect cheilostomes during the
Thanetian and the Priabonian; at other times, encrusting and erect cheilostomes
exhibited similar patterns of extinction rate. The substantial Palaeogene to
Neogene decline in erect species from approximately 50 percent to approximately
25 percent of the bryozoan fauna (McKinney
and Jackson 1989) may be due, at least in part, to the Priabonian
extinction. Our data suggest contrasting
extinction patterns of erect and encrusting cheilostome genera in the Pliocene
and Pleistocene (Figure 14B), with high
extinction rates of erect cheilostomes in the Pliocene followed by low
extinction rate in the Pleistocene, and the opposite pattern in encrusting
genera. These patterns for genera
parallel the
strong Neogene decline of erect cheilostome species in the Caribbean described
by Cheetham and Jackson (1996).
They noted that the decline in proportion of erect cheilostomes is in part due
to more vigorous speciation of encrusting species but is largely due to
preferential extinction of species in erect genera.
Originations
Origination rates for
bryozoan genera (Figure 9) do not show
the Maastrichtian and Danian anomalies that characterise extinction rates. In
general, origination rates were higher and more variable during the Late
Cretaceous than during the Cenozoic
and were the
cause of the steep rise in overall bryozoan diversity through the Late
Cretaceous (Figure 2).
Cyclostomes
Cyclostome originations
were high throughout the Late Cretaceous (Figure
8, Figure 10). Maastrichtian
originations are the highest among these only in three of the six measures (Figure
10B-D), suggesting that Maastrichtian originations are part of the continuum
of high originations during the most active period of cyclostome
diversification. Following the K-T extinction, however, cyclostome originations
remained very low throughout the Cenozoic by most measures, although there may
have been a slight increase in originations during the Neogene (Figure
10E, F). This possible Neogene increase did
not result in an increase in cyclostome
diversity (Figure
2) because it was
matched by a
slight increase in extinctions (Figure 5E,
F).
Cheilostomes
Cheilostome generic
originations show an overall pattern of decrease through the Late Cretaceous and
Cenozoic (Figure 8, Figure
11). The decline in cheilostome generic origination rate may reflect the
general temporal decline in origination rates of higher taxa as a progressively
greater proportion of new species are established within previously established
higher level clades (cf. Flessa and
Jablonski 1985), or it may mark near-saturation of the ecosystem as
suggested by Sepkoski et al. (2000).
Cheilostome originations during the Maastrichtian and
Danian are remarkable only for the fidelity with which they fit within the
long-term trend. There are three stages for which originations fall
substantially below the long-term trend-line (e.g. Figure
11E, F): Upper Palaeocene (Thanetian) and both stages of the Oligocene (Rupelian,
Chattian). Generic origination rates do not support Voigt's
(1981) notion of the Danian as a stage of low 'creativity'. For the
Cenozoic, the Danian was characterised by high origination rates, even though
many of the bryozoan genera thought of as typical of the Cenozoic (e.g., Sertella,
Schizoporella, Microporella) did not appear until later in the Palaeogene.
The general taxonomic composition of Danian cheilostome faunas has greater
similarity to Late Cretaceous faunas than to later Cenozoic faunas. This is
because numerous genera that originated in the Cretaceous survived into the
Danian before becoming extinct, not because of anomalously few generic
originations.
Cenozoic contrasts
in origination rates
In contrast with the
similarity in median extinction rates of cyclostomes and cheilostomes, median
origination rates (O/D/myr) for cyclostomes are 0.013 and for cheilostomes are
0.028. Overall Late Cretaceous through Cenozoic origination rates of the two
clades (Figure 13B) correlate better (r
= 0.786) than do overall extinction rates. However, the correlation is almost
entirely due to correspondence of rates during the Cretaceous (r = 0.838) when
both clades were vigorously diversifying, whereas the rates are almost
independent of one another (r = 0.101) during the Cenozoic. The low correlation
in the Cenozoic is due to the Eocene rebound in origination rates of
cheilostomes, while the cyclostomes had no corresponding rebound. Our
analysis of extinction and origination of post-Palaeozoic bryozoans corroborates
the inference by Sepkoski et al.
(2000) that the essentially flat diversity of cyclostomes following the K-T
extinction was due to sustained low origination rates rather than an increase in
extinction rates. Sepkoski et al.
(2000) were comparing mid-Mesozoic through Cenozoic diversities of
cyclostome and cheilosotme bryozoans with coupled-logistic curves in which
standing diversity of each clade suppresses origination rate (but has no effect
on extinction rate) of the other. (Parameterization of variables in the
calculation of the model was based on estimates of background extinction rates,
equilibrium diversity, and the initial diversification rates only of the
bryozoan clades.) The model, perturbed by a sudden diversity reduction
simulating the K-T extinction, closely matched the actual diversity histories of
cyclostomes and cheilostomes. Sepkoski
et al. (2000), therefore, concluded that actual diversity history of
cyclostomes and cheilostomes is consistent with competitive interference between
them, which suppresses origination rates. Our analysis of origination and
extinction of cyclostomes and cheilostomes broadly supports the assumptions of
the Sepkoski et al. model, although, like Sepkoski et al., we note that while
the history of post-Palaeozoic bryozoan diversity is consistent with a model
based on competitive interference, other biological or physical factors
may have been influential.