| Case study 6 - Systematics of Cambrian trilobites and the Eutheria |
Data files: paradoxididae.nex, and
eutheria.nex
Babcock (1994) produced character matrices for several groups of Middle Cambrian trilobites. We will look at a matrix for the Paradoxididae family, with 24 characters and 9 genera.
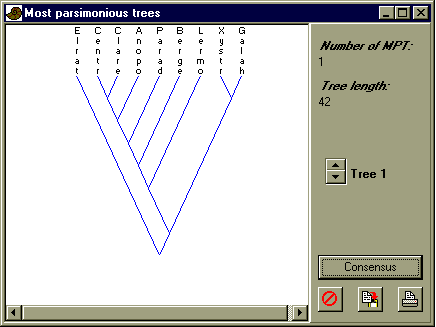
Read in the Nexus file paradoxididae.nex. Note the presence of unknown character states, indicated by '?'. Select all, and choose 'Parsimony analysis' in the Cladistics menu. Use the 'Branch-and-bound' algorithm with Fitch (unordered character states) optimization. You should get the following tree:

Elrathia is here used as the outgroup. Can you write down a possible reconstruction of how character H evolved along the branches of the tree? Also try Wagner optimization (assuming ordered characters). Does the tree change?
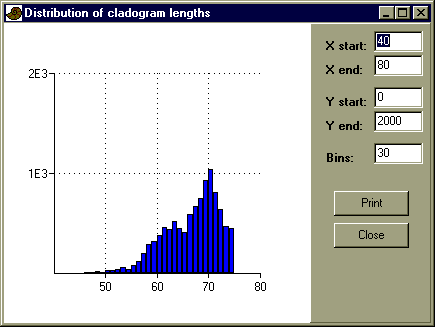
Choose Exhaustive search, with Fitch optimization. Around 135000 trees will be searched.

Does the distribution of cladogram lengths indicate that you have a 'good' or a 'bad' tree?

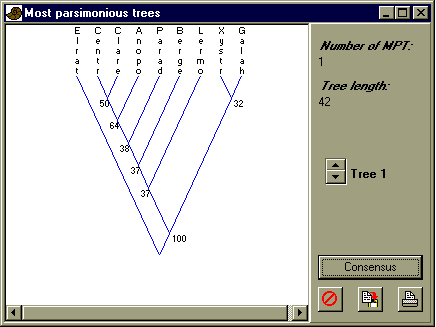
Discuss the bootstrap values. Which groups are well supported, and which are poorly supported?
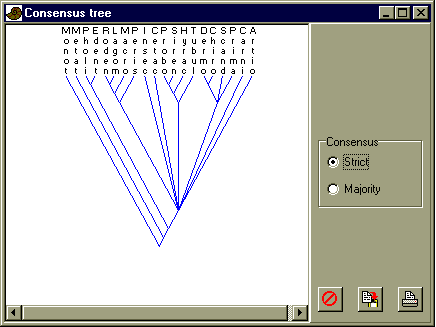
Read in the Nexus file eutheria.nex. There are no unknown character states. Select all, and choose 'Parsimony analysis' in the Cladistics menu. Use the 'Heuristic (NNI)' algorithm with Fitch (unordered character states) optimization. You will get a large number of most parsimonious trees. Look at a few of them, and then click on 'Consensus' in the 'Most parsimoniuos trees' window. The result may vary a little from run to run because of the random reordering procedure, but here is a typical result:

Look at the position of the primates. They seem to form a monophyletic group with the Scandentia (tree shrews), the Chiroptera (bats), and the Dermoptera (flying lemurs). Is that reasonable? What do you think of the position of the Perissodactyla?
More information about cladistic analysis can be found in the manual.