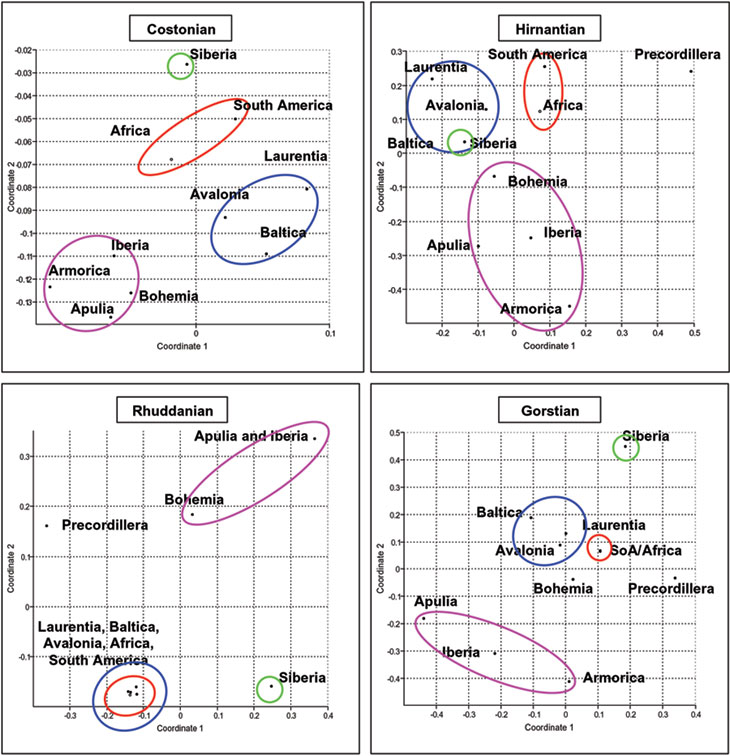
Figure 4. Selected Ordovician and Silurian NMDS diagrams at stage level of resolution using the Dice coefficient as the similarity indicator: Costonian (top left) (Shepard plot stress = 0.1688); Hirnantian (top right) (Shepard plot stress = 0.1418), Rhuddanian (bottom left) (Shepard plot stress = 0.08995) and Gorstian (bottom right) (Shepard plot stress = 0.1641). Red circles include Gondwanan terranes, purple circles include peri-Gondwanan terranes and blue circles include the core Iapetan terranes of Laurentia, Baltica and Avalonia. Green circles include Siberia. The Precordillera is not included in either of these groups, further note that the Precordillera plots very far from the rest of the plates in the Costonian diagram and therefore is not included. This is probably related to the small amount of data available from the terrane during this time.