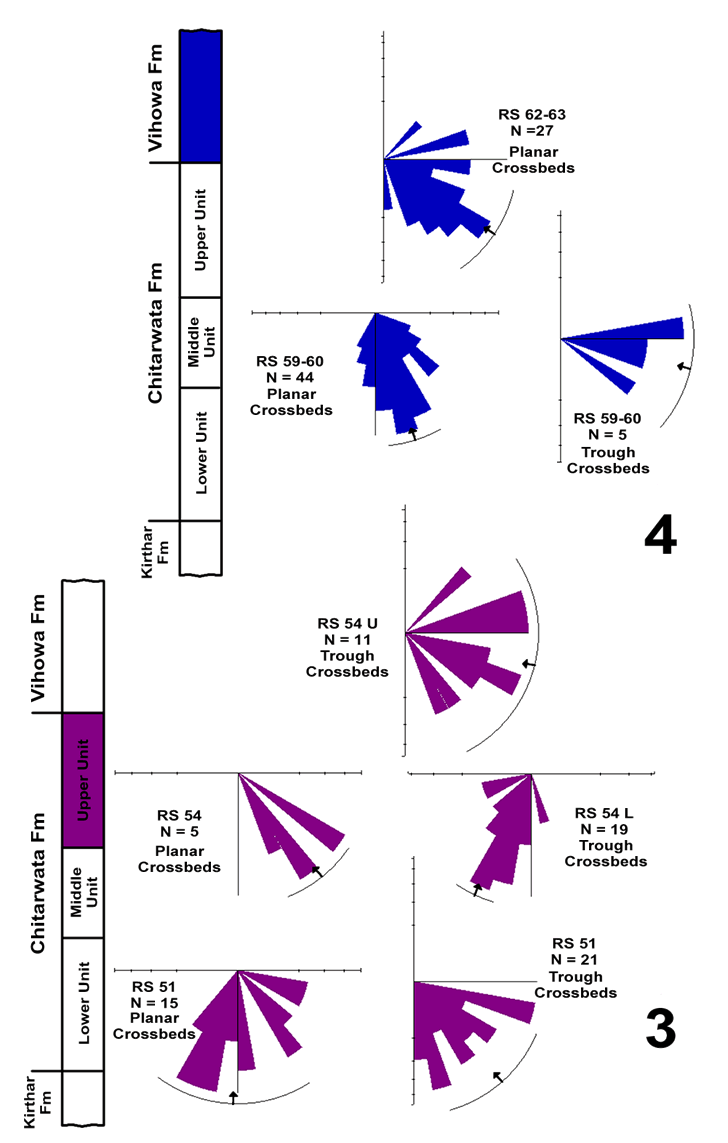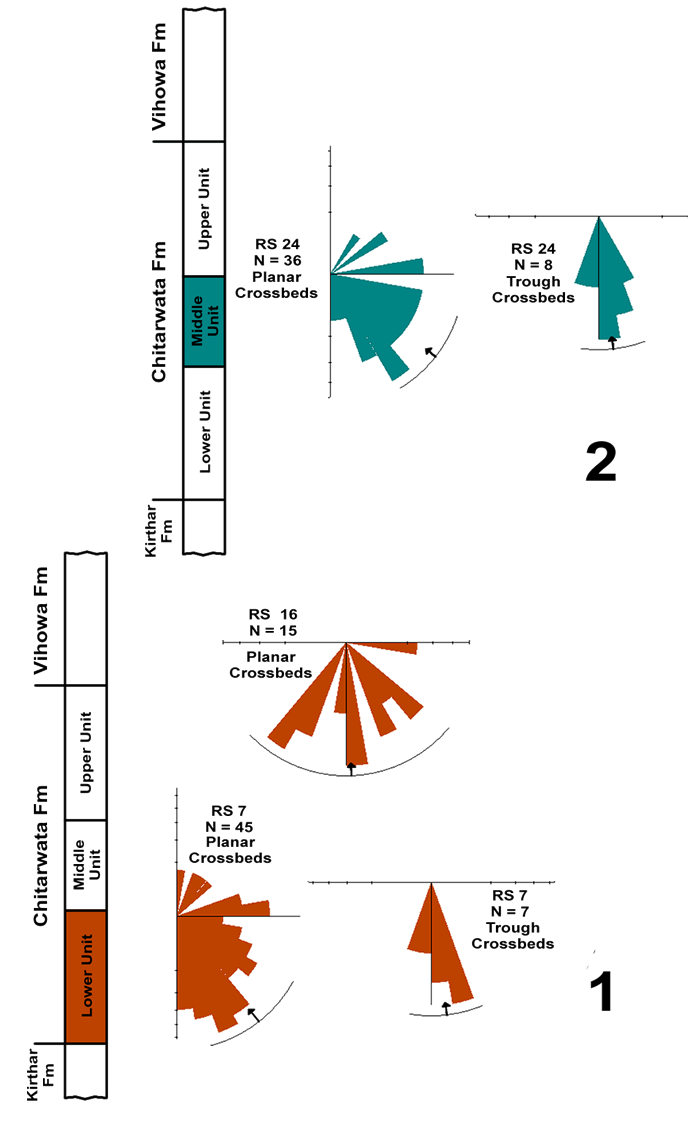

Figure 3. Rose diagrams for the paleocurrent information in the Chitarwata and Vihowa Formations (see Table 2 for statistics, mean directions, and confidence intervals). Arrow indicates mean resultant direction and arc represents 95% confidence interval. 1: Lower Unit of the Chitarwata Formation (RS 7 and RS16), 2: Middle Unit of the Chitarwata Formation (RS 24), 3: Upper Unit of the Chitarwata Formation (RS 51 and RS 54), 4: Lower Vihowa Formation (RS 59-60 and RS 62-63).

