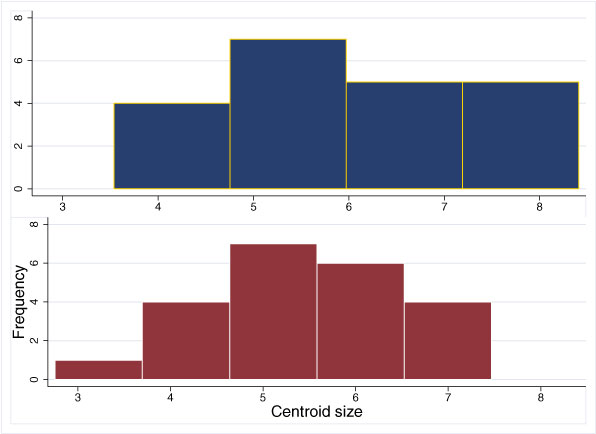
Figure 2. Histograms of centroid sizes in 060700-2A (upper graph) and 052500-1C (lower graph). There is no statistical difference between the two populations (t-test, p = 0.2283).