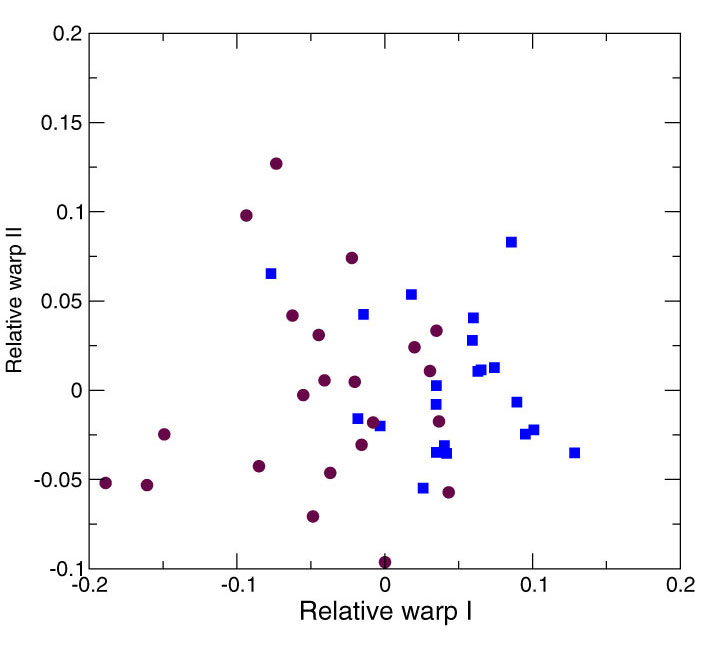
Figure 3. Plot of relative warp scores (I and II) of 060700-2A in blue squares and 052500-1C in red circles. Although overlap does occur between the two populations, they differ from one another statistically.