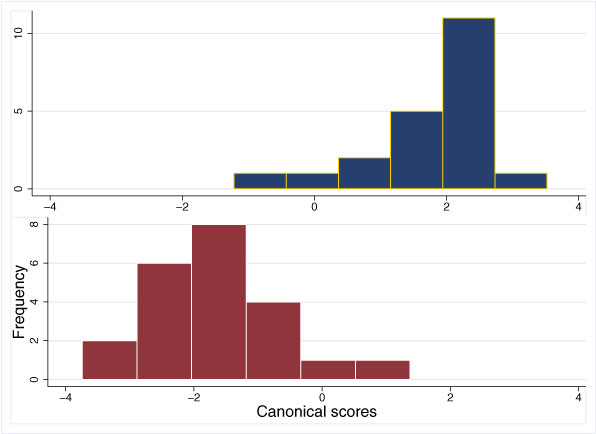
Figure 4. Distributions of canonical variate scores in 060700-2A (upper graph) and 052500-1C (lower graph). There is a highly significant difference between the two populations (Wilks' Lambda, p < 0.0001).