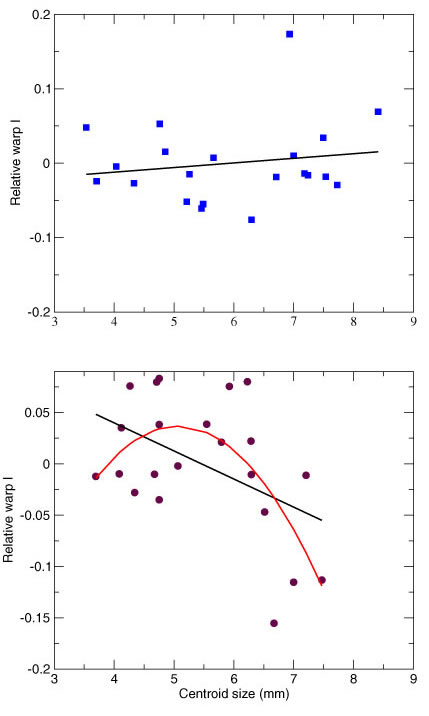
Figure 5. Plots of shape (relative warp score I) and size in 060700-2A (A; upper graph) and 052500-1C (B; lower graph). A. Linear regression indicates no change in shape with increasing sizes. B. A second-order polynomial regression indicates an allometric relationship with shape changing with size and is a better fit than a linear regression.