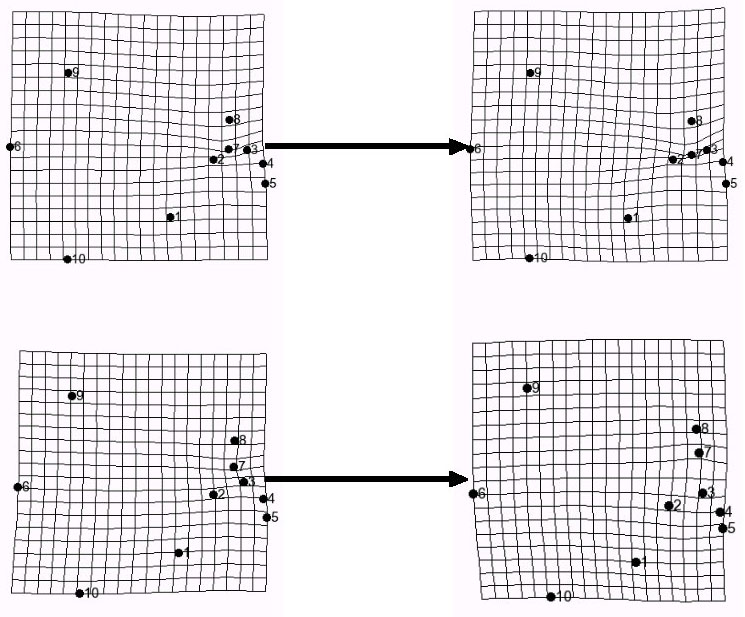
Figure 6. Thin-plate spline diagrams of predicted specimen shapes (relative warp I) at centroid size 4 mm and 7 mm for sample 060700-2A (upper diagram) and 052500-1C (lower diagram). Note the lack of significant changes in 060700-2A and the difference around landmarks 3 and 7 for sample 052500-1C. Pixelation of the figure is a function of the analysis routine's output.