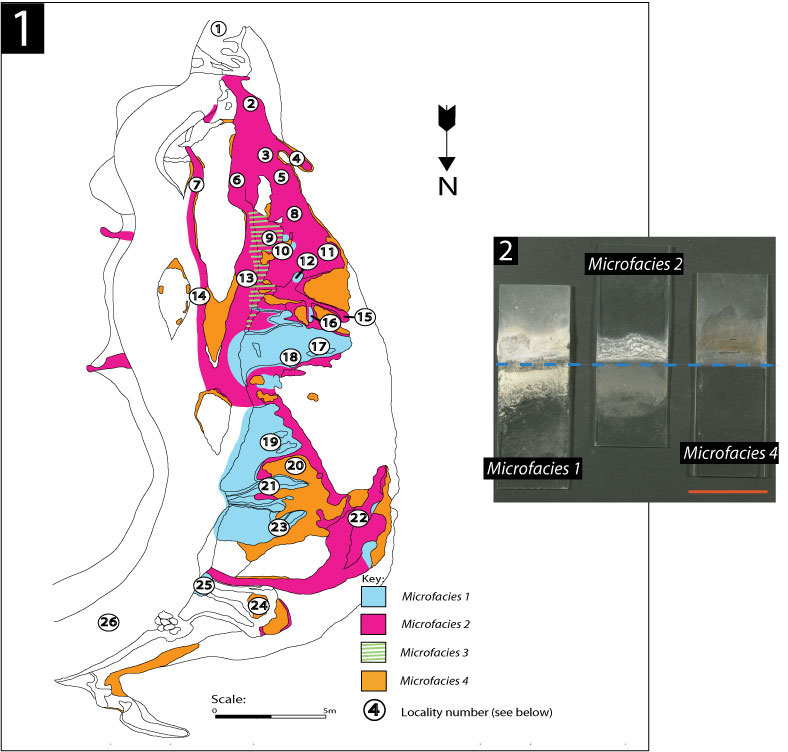
Figure 4. Characteristics of discharged thermal water from each microfacies. 4.1 Map of the study site showing approximate microfacies locations. Numbers refer to localities were measurements were taken (see Figure 4.3). (4.2) Representative examples of glass slides with subaerially accreted silica after 67 days. Differences between slides indicate different rates of subaerial silica accretion. Dashed blue line marks average water level. Note the relatively large subaqueous sulphur accumulation in Microfacies 1. A yellow-light brown substance (sulphur? and/or organics?) accumulated subaqueously in Microfacies 2. Bar represents ~3 cm. Silica accretion rates were unable to be measured for Microfacies 3. (Continued below.)  

Figure 4 (continued). 4.3. Temperature, pH, water level changes and silica accretion measurements. N.R. = not recorded. No significant water temperature changes were observed between seasons.

Locality
number
Microfacies Water temperature
(summer/winter)
(°C)
Water level
(summer/winter)
(mm)
Water
pH
Silica accumulation
over 67 days (g)

1

Stream

30.8/17

150/159

2.03

N.R.

2

2

49

12/14

2.3

0.1287

3

2

55

N.R.

2.25

N.R.

4

2

58

20/23

2.14

N.R.

5

2

57.9

8/12

2.23

N.R.

6

2

55

12/18

2.23

0.1289

7

2

54.6

12/15

N.R.

N.R.

8

2

58

12/16

2.3

0.1281

9

2 and 3

59.8

6/10

2.13

N.R.

10

4

45

No change

2.24

0.0092

11

2

85

10/12

2.10

0.0802

12

1

64.2

10/14

2.13

N.R.

13

2

54

10/19

2.12

N.R.

14

2

38.8

130/136

N.R.

N.R.

15

2

63

5/8

2.24

N.R.

16

1

63.9

6/10

N.R.

N.R.

17

1

83.2

N.R.

2.28

0.2752

18

1

76.1

25/28

N.R.

N.R.

19

1

78.2

20/25

N.R.

0.2036

20

4

67

No change

N.R.

0.0098

21

1

84.6

N.R.

2.26

N.R.

22

2

59.4

18/20

2.23

N.R.

23

1

78.1

21/25

2.27

N.R.

24

4

52

No change

2.22

N.R.

25

1

91

N.R.

N.R.

N.R.

26

Stream

33.2/20.9

120/130

N.R.

N.R.