|
|
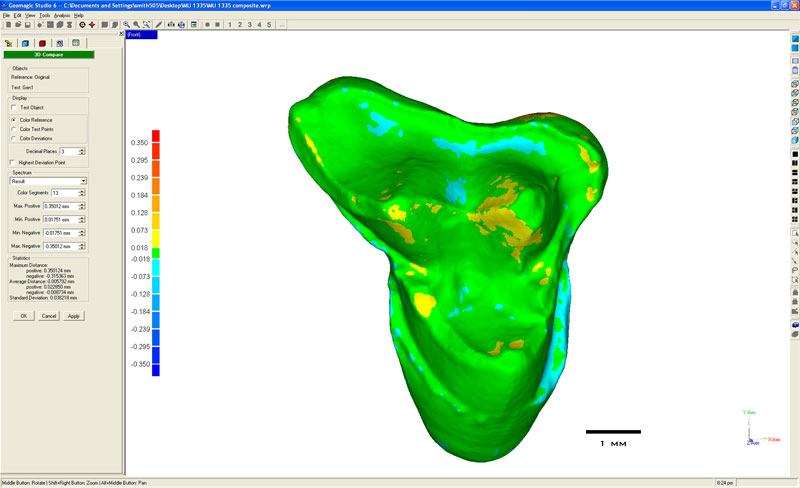
Figure 12. Screen capture of the 3D compare function in Geomagic Studio that highlights regions of correspondence and deviation between the two models of an Arfia junnei upper molar (UCMP 216155). Surfaces shown in green deviate less than ± 0.018 mm from one another while blues and reds represent regions of positive and negative relief, respectively.
|