|
|
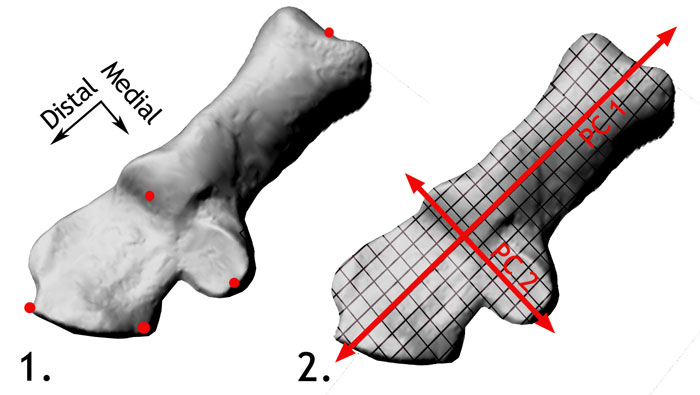
Figure 3. 3.1 Five landmarks used to superimpose the surface scan data prior to fitting the analytical surface points. 3.2 Schematic diagram of the grid laid onto each surface to divide it into subequally spaced analytical points.
|
|
|
Figure 3. 3.1 Five landmarks used to superimpose the surface scan data prior to fitting the analytical surface points. 3.2 Schematic diagram of the grid laid onto each surface to divide it into subequally spaced analytical points.
|