|
|
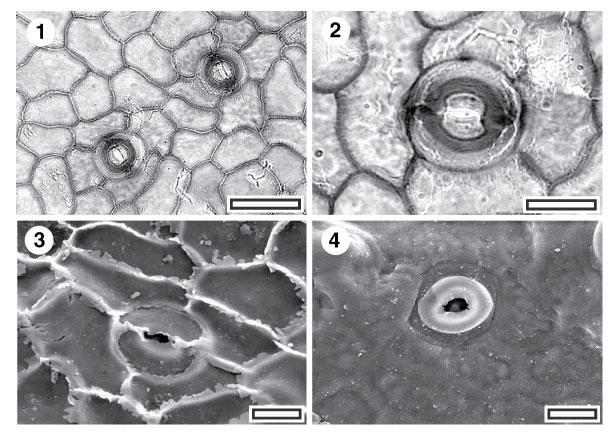
Figure 6. 1-4. Fossil Atherospermataceae: CUT-Z-CEF. 1. TLM view showing two stomatal complexes (SL0100, scale-bar = 50 µm); 2. TLM detail of single stomatal complex (SL0100, scale-bar = 20 µm). Note the distinctive outer stomatal rim; 3. SEM view of inner cuticular surface showing a single stomatal complex (S-1112, scale-bar = 20 µm); 4. SEM view of outer cuticular surface showing a single stomatal complex with prominent outer stomatal ledges (S-1112, scale-bar = 20 µm).
|