![]()
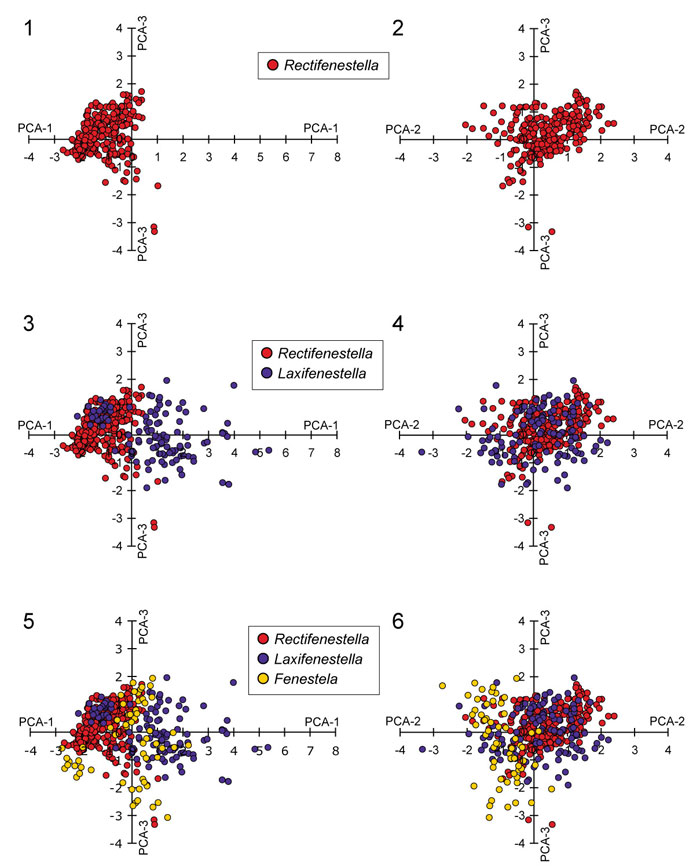
FIGURE 11. Scatter plots of observations by genus (Rectifenestella, Laxifenestella and Fenestella) on (1, 3, 5) PCA-1 vs. PCA-3 and (2, 4, 6) PCA-2 vs. PCA-3. See Figure 12.1 for three-dimensional animation with Rectifenestella highlighted. See Figure 12.2 for three-dimensional animation with Laxifenestella highlighted. See Figure 12.3 for three-dimensional animation with Fenestella highlighted.