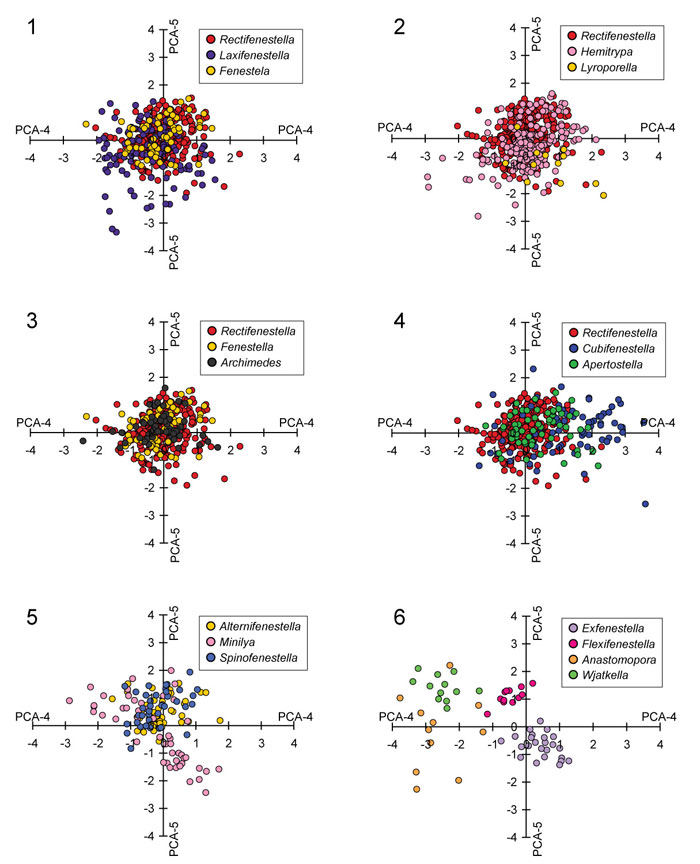
FIGURE 13.
Scatter plots of observations by genus on PCA-4 vs. PCA-5 for all genera.