![]()
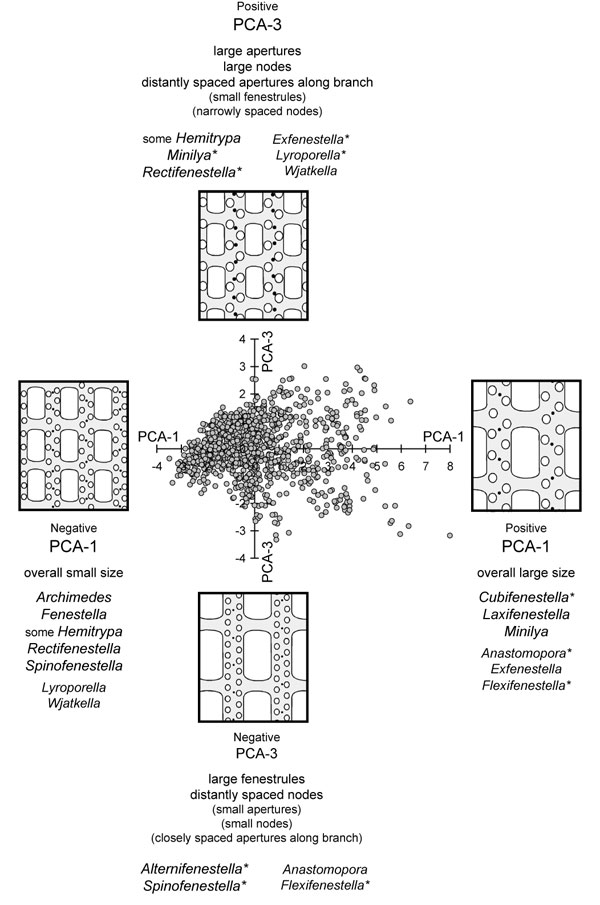
FIGURE 3. Scatter plot of PCA-1 vs. PCA-3, which combined account for 51.9% of the total variance. PCA-1 is positively correlated with the size of each of the nine characters in approximately equal weight (Table 4). PCA-3 reflects an inverse relationship between the size of apertures and nodes and spacing of apertures vs. the size of fenestrules and spacing of nodes (Table 5). Figure 4 is an inclined, three-dimensional view of this image. The only two genera that do not display a cohesive cloud with a predictable distribution on PCA-1 are Alternifenestella and Apertostella. Five genera (Apertostella, Archimedes, Cubifenestella, Fenestella, and Laxifenestella are centered (no predictable distribution) on PCA-3.