![]()
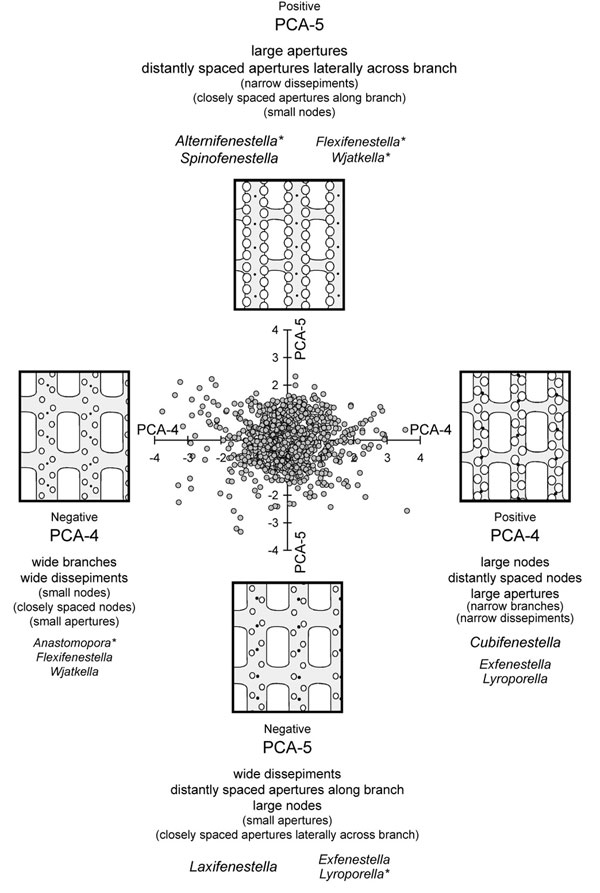
FIGURE 7. Scatter plot of PCA-4 vs. PCA-5, which combined account for 17.4% of the total variance. PCA-4 reflects an inverse relationship between the size and spacing of nodes with aperture size vs. the width of branches and dissepiments (Table 4). PCA-5 reflects an inverse relationship between the size of apertures and their lateral spacing across branches vs. the width of dissepiments, spacing of apertures along branch and size of nodes (Table 5). Figure 8 is an inclined, three-dimensional view of this image. Only one genus, Cubifenestella, has a notable distribution on PCA-4, whereas three genera, Alternifenestella, Spinofenestella, and Laxifenestella have notable distributions defined by characters associated with PCA-5.