![]()
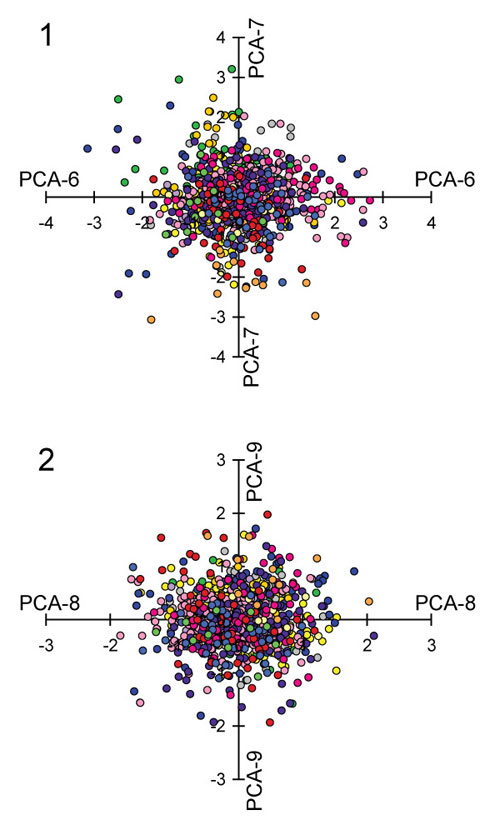
FIGURE 9. Scatter plot of principal components six through nine, which account for variation within genera (little discriminatory value among genera). (1) PCA-6 vs. PCA-7, which combined account for 11.2% of the total variance. PCA-6 reflects an inverse relationship between the width of dissepiments, lateral spacing and size of apertures vs. node size and spacing (Table 6). PCA-7 reflects an inverse relationship between the width of fenestrules and size of nodes vs. the spacing of nodes and spacing of apertures along branch (Table 6). Figure 10 is an inclined, three-dimensional view of this image. (2) PCA-8 vs. PCA-9, which combined account for 6.6% of the total variance. PCA-8 reflects an inverse relationship between the width of fenestrules and aperture spacing along branch vs. node diameter and lateral spacing of apertures across branch (Table 6). PCA-9 reflects an inverse relationship between the length of fenestrules vs. the spacing of nodes and lateral spacing of apertures across branch (Table 6).