![]()
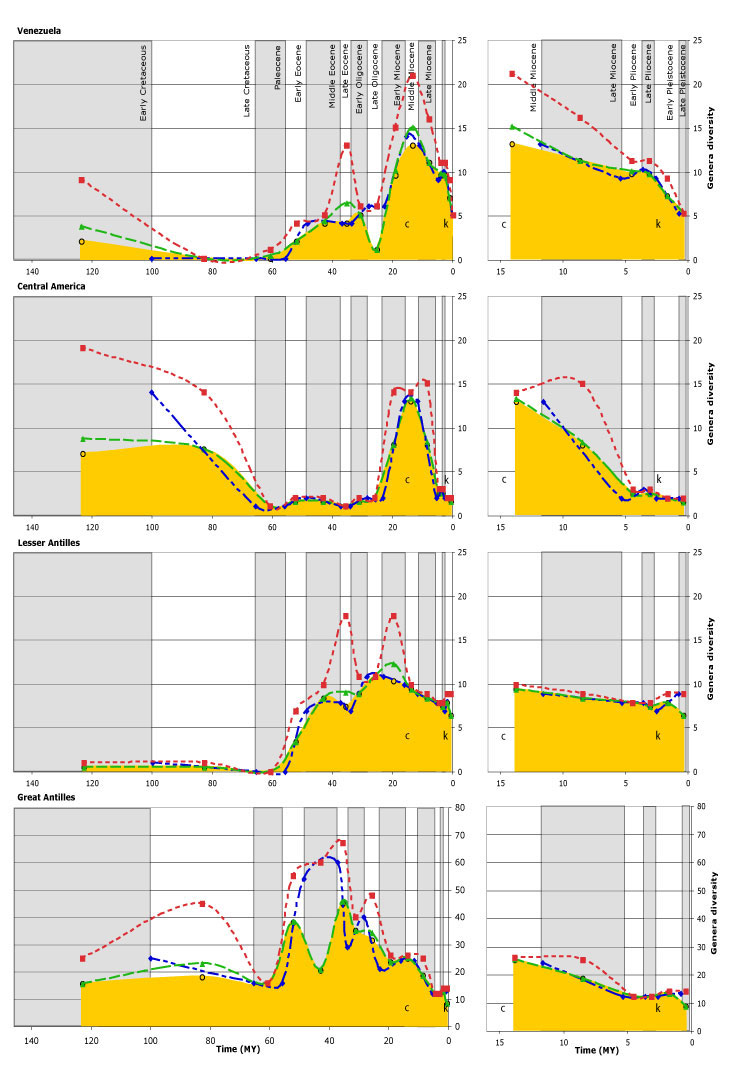
FIGURE 10. Diversity curves obtained by calculating the mean standing diversity with and without singletons and by counting boundary crossers of echinoids from different Caribbean regions.
|
|
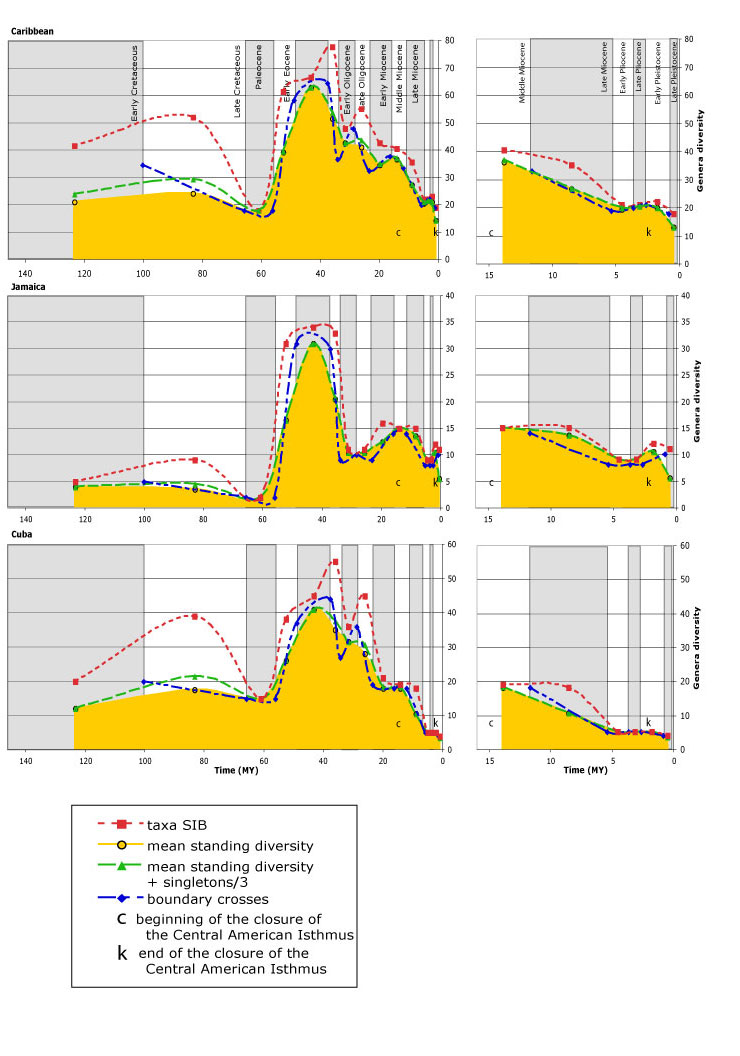
FIGURE 10. Diversity curves obtained by calculating the mean standing diversity with and without singletons and by counting boundary crossers of echinoids from different Caribbean regions.
|