![]()
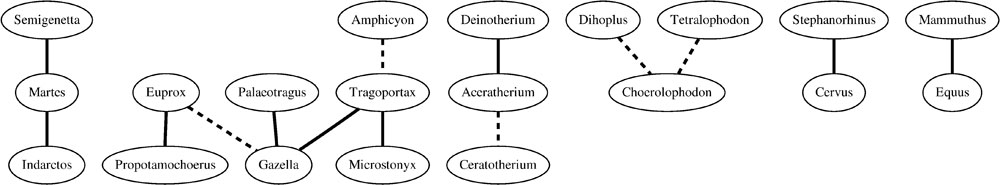
FIGURE 2. Correlations between genera with geographic filtering (GeoUnion). Genera are presented as ellipses, statistically significant positive correlations as bold lines, and negative correlations as dashed lines.
|
|
FIGURE 2. Correlations between genera with geographic filtering (GeoUnion). Genera are presented as ellipses, statistically significant positive correlations as bold lines, and negative correlations as dashed lines.
|