![]()
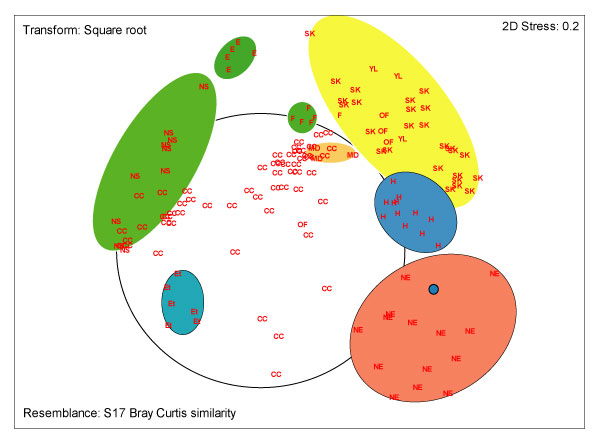
Figure 6. MDS plot of ATA data for shelf and deep sea. Major fields are coloured except for CC which is outlined. All the North Sea areas are green. E Ekofisk; Et Etive; MD Muck and Stanton deeps; F Forties; CC Celtic Sea and Channel; NS North Sea; H Hardanger; YL outer Lyngdalsfjord; SK Skagerrak, including Kragerø; OF outer Oslofjord; NE deep sea - NE Atlantic. Ellipses and circles are drawn to emphasize closeness between samples from similar environments.