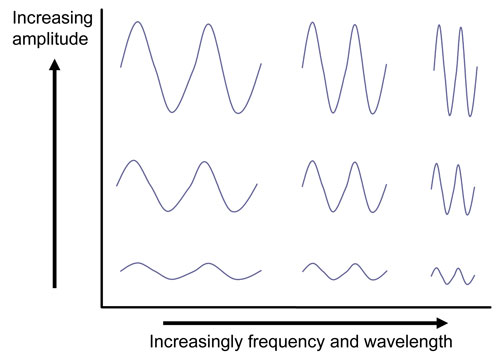
FIGURE 3.
Graph depicting waveforms of different amplitudes and frequency.