![]()
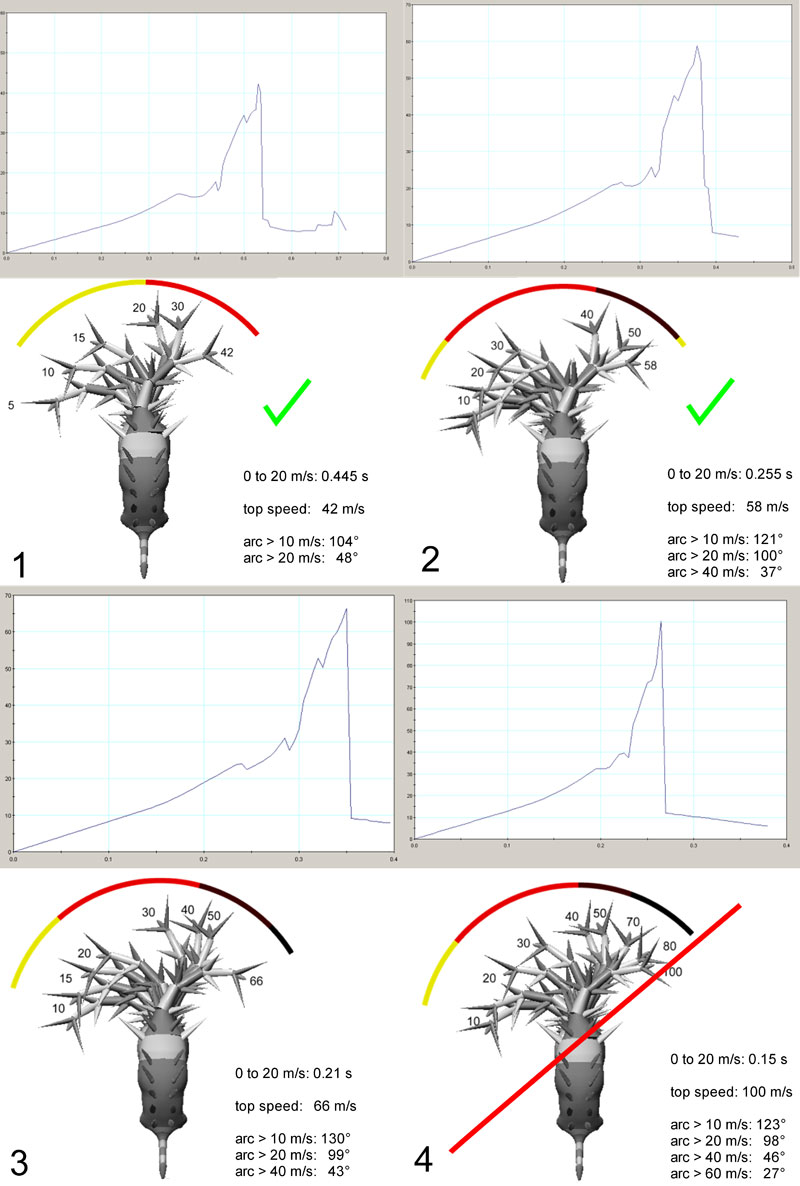
Figure 8. Modeling results of the 'croc' model. In each figure part the graph gives speed of the tail tip (m/s) versus time (s), and superimposed dorsal views of the model show position of the tail as given speeds of tail tip. Arc shows arcs covered by tail tip at speeds greater than 10 m/s, 20 m/s, 40 m/s, and 60 m/s. Time to accelerate to 20 m/s and top speed are given, as well as arcs covered above selected speeds. Specific tension is (1) 20 N/cm2, (2) 39 N/cm2, (3) 50 N/cm2, and (4) 78 N/cm2. Combinations of speed and muscle reconstruction deemed unrealistic are marked by a red diagonal line, results in the best estimate bracket are marked by a green check mark.