|
|
|
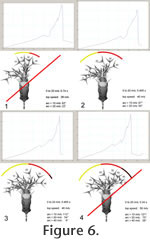
RESULTSTail Musculature ReconstructionThe three CAD model versions of the tail used here have total muscle cross section areas per side at the base of the tail of 365 cm2 ('slim' model), 615 cm2 ('medium' model), and 1265 cm2 ('croc' model). In comparison, the alligator sections scaled to the same bone dimensions show a larger muscle cross section area (1525 cm2) than even the 'croc' model. Calculated torque values available at the base of the tail vary between 542 Nm (specific tension 20 N/cm2, 'slim' model) and 13047 Nm (specific tension 78 N/cm2, 'croc' model). The 'medium' model delivers a range between 1112 Nm (20 N/cm2) and 4336 Nm (78 N/cm2). Mass Estimates and COM PositionThe 'slim' CAD model has a total volume of 1073 L. The 'medium' tail model is 17 L larger, and the 'croc' tail model nearly 195 L. Soft tissue density can range from 0.3 kg/L for goose necks (Bramwell and Whitfield 1974) to 1.2 kg/L, depending on the anatomical part of the organism that is being measured, such as neck, tail, or thorax (e.g., Schmidt-Nielsen 1984, 1997; Anderson et al. 1985; Christiansen and Farina 2004). Compact bones, of which the tail spikes are almost exclusively constructed, weighs nearly 2 kg/L (Currey 2002). Generally, terrestrial animals have an overall density of roughly 1 kg/L, but values as high as 1.15 kg/L have been reported (Bellmann et al. 2005). Here, all body parts were given a density of 1 kg/L, except for the tail (1.25 kg/L). All values were varied in all model versions to account for slightly different soft tissue reconstructions. An adult Kentrosaurus is thus estimated to have weighed between slightly over1 t to 1.5 t. Different distributions of the osteoderms showed a similar shift in COM position as variations of density in different body parts. Overall, as long as the volume of soft tissues was varied within sensible borders in one segment (forelimbs, trunk, hindlimbs, or neck), the COM was not displaced by more than 0.05 m, except for a mass increase in the tail by 195 kg (switch from 'slim' to 'croc' model, which moved the COM 0.15 m posteriorly. The percentage of body weight supported on the hindlimbs varied between 70% and 94%, with most values in the 80-85% bracket. Varying the mass of the model outside the tail had no significant influence on the performance of the tail. The COM showed only minimal lateral and craniocaudal motions for all tail deflection angles, with full 6° deflection leading to a maximal motion laterally of 0.086 m and 0.017 cm craniocaudally. Accelerations remained significantly under 0.5 g in all non-whiplash models, with maximum values of 0.63 g achieved in simple whip motions, in which the tail slammed into the motion limits of the joints unchecked. More complex whip models achieving higher speeds showed lateral accelerations below 0.2 g. There were no significant differences between the detailed and the simplified tail models. Accelerations reached levels of ~ 7 g for impacts on a generic body of 750 kg that represents a mid-sized to large theropod. However, such models must be interpreted with caution, because the Kentrosaurus model is internally stiff, so that there is no cushioning of the impact at all, while in reality the tail itself would probably passively flex along the entire length to absorb the energy. Therefore, these models were no longer assessed. Continuous Tail Swings
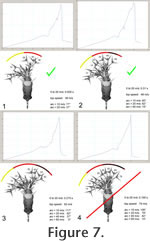
Whiplash Tail Swings
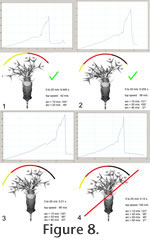
Impact ForcesAt a tail tip weight of 10.7 kg with one tail tip spike pair, the 'slim' model can exert a pressure of over 3800 N/cm2 at speeds as low as 5 m/s for a strike with a 0.28 cm2 tip of a spike. At 8 m/s the impact exceeds the failure parameters of the frontal region of the human skull, which is between 4448 N/cm2 and 6200 N/cm2 (Ono et al. 1980), for a 0.28 cm2 spike tip, and at 20 m/s and 25 m/s for a 1 cm2 tip. At 20 m/s the pressure would be over 15 kN/cm2 for a 0.28 cm2 tail tip area. This is close to the shear stress of cortical bone as listed by Carpenter et al. (2005), but significantly higher than the various values given by Currey (2002). An impact at 40 m/s impact velocity might push the spike tip so deep into the target body that bones a significant distance from the surface could come into contact with the spike tip, e.g., caudal vertebrae. Even across a 10 cm2 impact area, which corresponds to a penetration depth of nearly 30 cm, a pressure of nearly 1 kN/cm2 would have been available.
Hennig (1925) and Janensch (1925) envisaged the tail osteoderms as evenly distributed, with one pair of terminal spikes. If there were two closely spaced pairs of spikes on the distal tail end as in Stegosaurus (Carpenter 1998), the impact forces would be significantly increased by the much larger mass of the tail tip. Accelerations, however, would be only minimally smaller, because the added mass of a second spike pair is negligible compared to the mass of the entire tail. Similarly, if the contact time was greater due to a reduced deceleration of the impacting spike, e.g. when impacting on soft tissues or on a body part with very thin bones (e.g., a skull), a larger part of the distal tail could contribute its impulse to the collision, further increasing the pressure. |
|