![]()
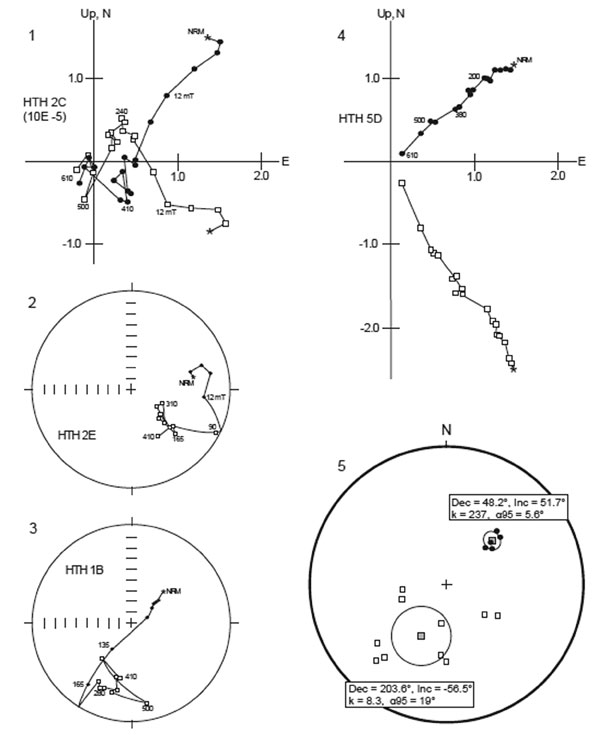
FIGURE 24. 1. Orthogonal vector diagram representative of sample demagnetization that did not allow calculation of a mean direction using principle components analysis (solid circles represent declination, or horizontal component; open squares represent inclination, or vertical, component); 2 and 3. Equal area stereo plots showing unambiguous polarity determinations based on the position and trend of the horizontal and vertical components for samples in which mean directions could not be calculated using principle components analysis (solid circles represent magnetic directions in the lower hemisphere; open squares represent magnetic directions in the upper hemisphere). 4. Orthogonal vector diagram representative of sample demagnetization from which a mean direction could be calculated using principle components analysis. 5. Equal area stereo plot showing mean directions of normal and reversed sites.