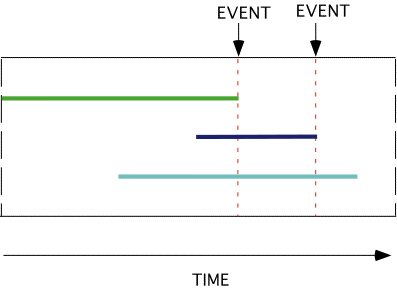
Figure 1. This shows a simple example of diversity, with a calculation interval of one.

Figure 2. Diagram to help to explain the procedure for calculation of the EISS.

Figure 3. Diagram to help explain the EISS procedure for multiple extinctions.

Figure 4. The two "valid" cases for the A-D extinction test. Case 1 shows the ancestor outliving the descendant, Case 2 shows the descendant outliving the ancestor. In this and all following diagrams, taxa with an arrow survive and taxa with a circle have become extinct. Ancestral taxa are shown in blue, descendants in red.

Figure 5. Topologies relating to the A-D speciation and A-D speciation (restricted) test.

Figure 6. Diversity of the random phylogeny generated by TREE GROWTH across simulation time.

Figure 7. Dynamic survivorship and CSS curves for the TREE GROWTH data.

Figure 8. EISS plot for the TREE GROWTH data.


