Figure 1. Right valves of A) Chione erosa from the lower Pincecrest Beds (Lower Pliocene), and B) C. cancellata from the Recent of Florida. Note the naticid drill hole in A. Scale = A) 5mm, and B) 10mm. Specimens are from the author's collection.
Figure 2. Close-up of the naticid drill hole shown in Figure 1. Diameter of the drill hole (white line) is 4.17mm.
Figure 3. Schematic stratigraphic chart of Late Neogene/Pleistocene deposits in south Florida. 
Figure 4. Homologous landmarks selected for morphometric description. A - umbo, B - ventral end of lunule, C - ventral end of anterior cardinal tooth, D - ventral end of posterior cardinal tooth socket, E - dorsal terminus of anterior adductor muscle scar, F - ventral intersection of anterior adductor muscle scar and pallial line, G - dorsal terminus of posterior adductor muscle scar, H - intersection of margin of posterior adductor muscle scar and pallial sinus, I - ventral end of escutcheon. Landmarks F and H represent the baseline ([1,0] and [0,0] respectively) for computation of shape coordinates.
Figure 5. Distribution of equal-area quadrats on the surface of a valve. Numbers mark the location of landmarks used in the morphometric analysis. Open circles are the locations of drill holes on specimens from the Bermont Fm., filled triangles are those from the Ft. Thompson Fm. Note the more dorsal concentration of drill holes in the Ft. Thompson specimens.
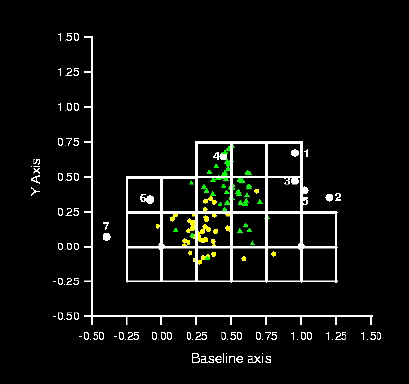
Figure 6. Distribution of canonical scores on the first canonical axis, from CVA of the morphometric data. Vertical dashed line separates Pliocene from post-Pliocene samples. Sample numbers are: 1 - middle Pliocene Jackson Bluff Fm. (northwest Florida), 2 - middle-Upper Pliocene Pinecrest Beds (west central Florida), 3 - Upper Pliocene Caloosahatchee Fm. (central Florida), 4 - Lower Pleistocene Bermont Fm. (west central Florida), 5 - Middle Pleistocene Ft. Thompson Fm. (west central Florida), 6 - Upper Pleistocene Anastasia Fm. (east central Florida), and 7 - Recent (east central Florida). These results reproduce those presented previously by Roopnarine (1995), but are based on narrower geographic coverage.
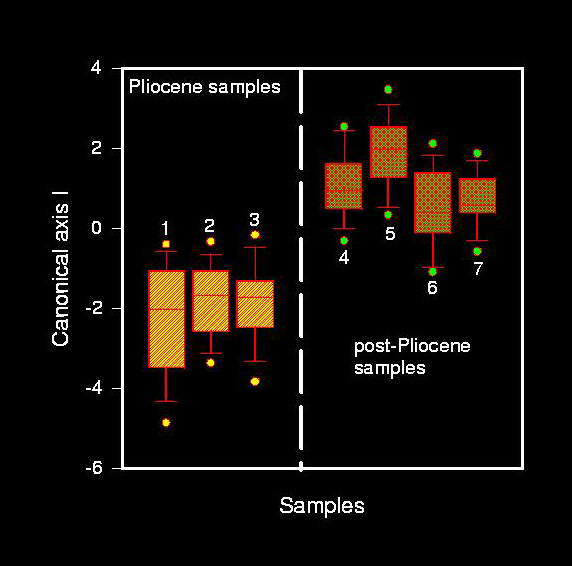
Figure 7. Thin plate spline representations of uniform (left) and non-uniform (right) transformations. Landmarks are: 1 - umbo, 2 - ventral end of lunule, 3 - ventral end of anterior cardinal tooth, 4 - ventral end of posterior cardinal tooth, 5 - dorsal end of anterior adductor muscle scar, 6 - dorsal end of posterior adductor muscle scar, 7 - ventral end of escutcheon. Baseline comprises the intersection of the posterior adductor muscle scar and pallial line (0,0), and the ventral intersection of the adductor muscle scar and pallial line (1,0).
Figure 8. Distribution of drill holes on valve surfaces during each geological formation. The xy plane represents the grid illustrated in Figure 5. z axis represents the frequency of drilling per quadrat.
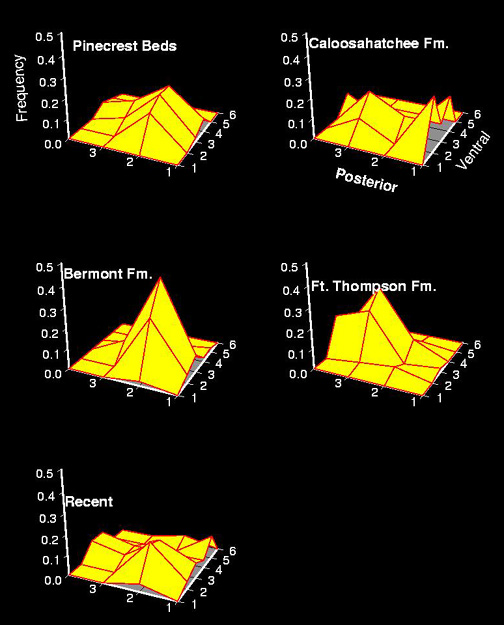
Figure 9. A) Intersample comparison of prey size selection. Each box represents the distribution of slopes for 1,000 bootstrap iterations of valve height (h) regressed on outer drill hole diameter (ob). Vertical dashed line marks the Plio-Pleistocene transition. Sample numbers are: 1 - Pinecrest Beds, 2 - Caloosahatchee Fm., 3 - Bermont Fm., 4 - Ft. Thompson Fm., and 5 - Recent. The samples differ statistically only among their regression slopes (intercepts are not statistically different), and fall into three statistically distinct groups: (1) The Pliocene Pinecrest Beds (h = (0.72ob)+2.49 [P < 0.001]) and Caloosahatchee Fm. (h = (0.87ob)+2.20 [P=0.005]), (2) the Lower Pleistocene Bermont Fm. (h = (0.24ob)+2.92 [P=0.001]) and (3) the Middle Pleistocene Ft. Thompson Fm. (h = (0.56ob)+2.45 [P=0.019]) and the Recent (h = (0.55ob)+2.50 [P < 0.001]). B) Plot of the regressions relationships summarized in (A). Colors follow those of the symbols in (A): red - Pinecrest Beds, cyan - Caloosahatchee Fm., white - Bermont Fm., yellow - Ft. Thompson Fm. and green - Recent. The figure demonstrates clearly the significant decrease in the stereotypy of prey size selectivity associated with the Plio-Pleistocene transition, followed by an increase during Ft. Thompson time.
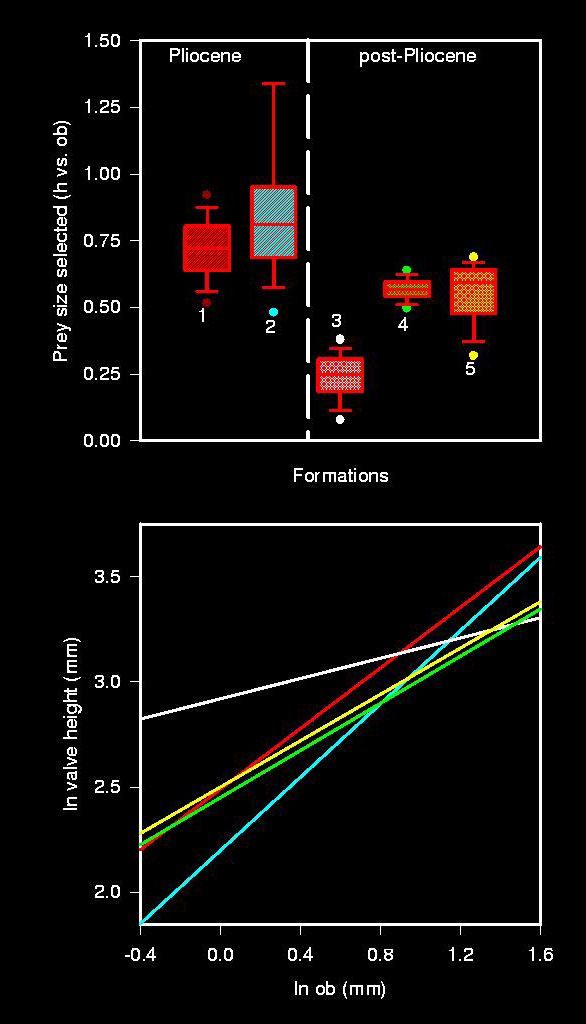
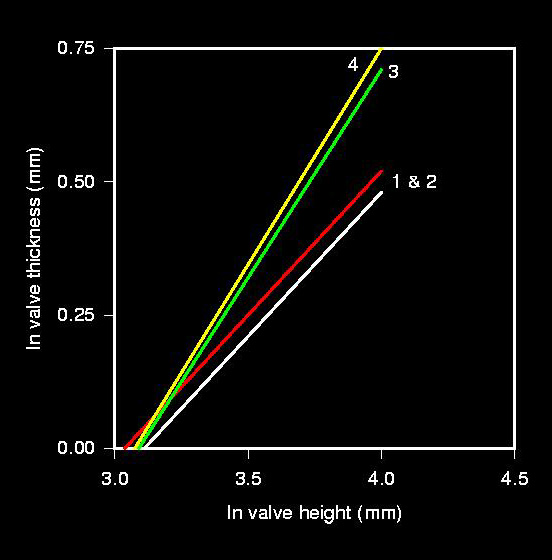
Figure 10. Valve thickness (t) regressed on valve height (h). Each line represents the median line of 1,000 bootstrap iterations. Sample numbers are: 1 - Pinecrest Beds, 2 - Bermont Fm., 3 - Ft. Thompson Fm., and 4 - Recent. The Caloosahatchee Fm. was excluded because of the lack of a significant regression (due possibly to an insufficient sample size). Lines 1 and 2 (t = (0.54h)-1.68 [P < 0.001] and t = (0.54h)-1.64 [P=0.007] respectively) are statistically indistinguishable, as are lines 3 and 4 (t = (0.78h)-2.41 [P < 0.001] and t = (0.81h)-2.49 [P < 0.001] respectively). Both pairs are however statistically distinct from each other, reflecting the significant increase of valve thickness from the Middle Pleistocene on. The lines were plotted to a valve height of 36mm, which is the approximate mean height of over 700 measured specimens of both C. erosa and C. cancellata (Roopnarine, 1996).