

 Laser confocal microscopy and geographic information systems in the study of dental morphology
Article number: 2.1.3A
Copyright Palaeontological Association, 15 March 1999
https://doi.org/10.26879/99003
Author biographies
Plain-language and multi-lingual abstracts
PDF version
Submission: 25 January 1999, Acceptance: 3 March 1999
ABSTRACT
The advent of computers has allowed the use of new analytical methods while the nature and methods of original data acquisition have seen fewer changes. Most analytical methods rely on landmark data that can be easily recorded from teeth. The choice of landmarks, however, may limit the scope of a study as decisions on data collection have to be made prior to recording the landmarks. Here we present a method to record and analyze tooth crown morphology of small teeth with almost no loss of shape information. Epoxy resin casts with eosin dye are optically sectioned with 25-100 µm intervals using a laser confocal microscope with fluorescence detection. Alternatively, original specimens of Recent teeth can often be optically sectioned in reflective light mode. High-resolution digital elevation models (DEMs) of tooth crowns are produced from the image stacks using the 3Dview version of the NIH-Image software (MacOS). Digital elevation models can be transferred to Geographic Information System (GIS) software as well as interpreted by surface rendering computer programs. All traditional morphometrical measurements can be obtained from DEMs. However, the total shape data (i.e., DEMs) can be explored with GIS prior to the selection of appropriate measurements. Furthermore, as the DEMs can be stored as a museum database of tooth morphologies, the three-dimensional morphology can be accessed remotely via the Web, reducing the need to visit museum collections or borrow specimens. This confocal scanning method is well-suited for large samples of small teeth and other small fossils.
Jukka Jernvall, Institute of Biotechnology, P.O. Box 56, FIN-00014, University of Helsinki, Finland. jvakudaret@aol.com
Lena Selänne, Department of Geology, Division of Geology and Palaeontology, P.O. Box 11, FIN-00014 University of Helsinki, Finland. lena.selanne@helsinki.fi
KEY WORDS: tooth, morphology, GIS, confocal microscopy, digital elevation models
Final citation: Jernvall, Jukka and Selänne, Lena. 1999. Laser confocal microscopy and geographic information systems in the study of dental morphology, Palaeontologia Electronica Vol. 2, Issue 1; 3A; 18p. https://doi.org/10.26879/99003
palaeo-electronica.org/content/2-1-confocal
INTRODUCTION
Carrying out a study on dental morphology can be usually divided into two phases; the acquisition of data and the subsequent data analysis. The advent of computers has enabled the analysis of large data sets with sophisticated multivariate methods (e.g., Dryden and Mardia 1998, Marcus et al. 1996). While analytical methods have developed substantially, the morphometrical data types acquired from teeth has seen far fewer changes. Indeed, most analytical methods rely on measurements made from discernible landmarks (but see Valeri et al. 1998) and the measurements acquired depend on the hypothesis, technical possibilities, and the investigator’s preferences.
In this article we introduce a new approach to studying dental morphology that adds one step to the normal data acquisition, but enables an exploratory analysis of tooth morphology. By creating high-resolution digital representations of tooth shape we show how, in addition to traditional measurements, an investigator can explore tooth shape parameters using Geographic Information System (GIS) software. We then present a laser confocal microscopy technique to generate digital elevation models (DEMs) of mammalian tooth crowns. This method is particularly suitable for small teeth (smaller than 10 mm).
Casting
Most laser-confocal microscopes can detect reflective as well as excited fluorescent light. Therefore, in principle, original teeth can be used for confocal imaging in the reflective mode. However, we were able to use original teeth in only certain cases and therefore developed a casting method to enable the detection of fluorescent light. We made epoxy resin casts (Translux D 180, Axon) with eosin (Eosin blue, Merck) as dye. Eosin is a common histological dye and highly fluorescent (excitation 525 nm, emission 545 nm). For casting, 100g resin, 45g hardener with accelerator (2 drops), and 0.5 ml of eosin solution were used (see Errata Note 16 March 1999). The eosin solution was prepared by dissolving eosin in 70% EtOH solution overnight. The next day any undissolved dye was removed using filter-paper. An eosin concentration of 1% in ethanol gave workable fluorescence, but a saturated solution (1mg/10ml) was found to work better in fast confocal imaging. A stronger eosin concentration makes the casts darker, but still translucent enough for inspection and removal of bubbles. The epoxy was poured into the molds with the help of a small syringe or brush, and air bubbles were removed manually. Casts were left to set for two days.
Confocal Microscopy
 In confocal microscopy only reflected light that is in the focal plane is detected (Figure 1). The widely-used confocal microscopes in contemporary biomedical research depend on a laser beam to scan the specimen. The use of laser light, while preventing the acquisition of a continuous spectrum image, allows the detection of narrow wave-length fluorescent light used in the study of cell biology and biochemistry. The single laser scanning beam can form two or more simultaneous images using filters to detect different wavelengths. These confocal microscopes have a motorized focus that allows accurate changes in the focal plane and automated collection of optical sections (Figure 1).
We used a Zeiss Axiovert 135M microscope with the BioRad MRC-1024 confocal system and an American Laser Corporation 60WL argon/krypton laser (maximum output 100mW) located at the Institute of Biotechnology, University of Helsinki. The confocal scanning is operated via Lasersharp software package (BioRad). Teeth or casts were attached with Blue-tackonto anobjective slide and oriented by eye to a desired plane. Care must be taken to insure that lower aspects of the occlusal relief are not overshadowed by higher features in order for the microscope to image the entire occlusal surface. In general, we arranged the teeth so that the tips of the main cusps fell on the same horizontal plane. We used Zeiss Plan-neofluar objectives with magnifications 2.5x and 10x. These lenses have working distances of 9.3mm and 5.6mm, respectively. The maximum scan-window areas, and hence maximum specimen size that can be recorded using one optical sectioning, are 12.8 x 10.2 mm and 3.2 x 2.5 mm respectively. Although lenses with smaller magnifications would allow larger specimens to be scanned, their lower light-gathering ability (= Numerical Aperture) results in a weak laser signal. Therefore, larger teeth were optically sectioned in several scan windows, which overlapped adjacent windows. The overlapping areas of resulting digital elevation models (DEMs) were used for alignment of partial DEMs to make a complete DEM of a tooth.
For epoxy casts with eosin dye, the laser power was usually set to 10% with normal scanning speed. The laser beam was filtered with T1 (triple dichroic) and T2A filter (560 DRLP filter that splits the light to red and green). The green light was detected with a photomultiplier using emission filter 522 DF 32 with low signal attenuation and gain set to maximum (1500). The iris, which controls the degree of confocality in the image, was set to 1.0-2.2, and black level was varied between 0-12 (to adjust gray value for zero-signal). These settings depend on several factors; particularly the magnification used and concentration of dye. In general, if the signal is too weak, the DEMs exhibit "black holes" (areas with no signal) and appear grainy. To increase a weak signal the scanning speed is set to slow, and the black level setting used to adjust the image. If the signal is too strong the individual scans are overexposed (with large areas becoming saturated), and the DEMs lack detail. To decrease a strong signal, we used the gain and black level settings. We found settings for attaining good DEMs that proved quite robust (see below), and the iris setting had no detectable effect on the DEMs until very large settings (>3.0) were attempted, resulting in the loss of confocality in individual scans.
For original specimens that are scanned in the reflective mode, the laser power was set to 3% with normal scanning speed. The laser beam was passed through a B1 beam splitter and a T1 (triple dichroic) filter. The emission filter was a blue reflection filter with normal signal attenuation and gain set to between 1000 and 1500. The iris was set to 0.7-2.0 and black level was between 0-18. In general, the reflective mode gave a strong signal when we used Recent specimens with clean enamel surfaces. Results with fossils were variable depending on the degree of enamel coloration.
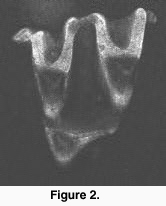 Each section was scanned three to six times, and the images averaged (Kalman averaging). Scanned stacks were saved as Biorad MRC 600-standard picture files (Figure 2). We found the use of confocal scanning fast for teeth that can be scanned with one window (up to 20 specimens/hour), but the need to scan large teeth in several pieces considerably reduced the data acquisition speed.
Digital Elevation Models
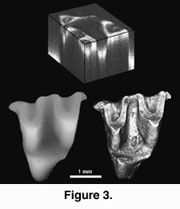 We used the 3Dview version (public domain by Iain Huxley) of National Institute of Health (NIH) Image software to make high-resolution digital elevation models (DEMs) from the image stacks (Figure 3). First, we imported an image stack to 3Dview using Biorad MRC 600 import macro (Figures 2, 3). The 3Dview software uses an autofocus method (e.g., Hamilton and Wilson 1982) to construct the DEMs. The software searches for the brightest section for each x-y coordinate point and then fits a surface along the brightest points.
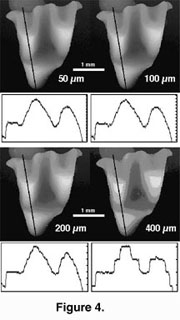 A parabolic fit was used to produce our DEMs. We tested the accuracy of the DEMs by creating digital objects and sectioning them using the NIH Image software. The DEMs were practically identical to the digital objects when the sectioning interval was adequate (see below, Figure 4). Software DEM calculation takes only a few seconds with an Apple iMac-computer. Additionally, the 3Dview calculates a maximum brightness image that shows the surfaces’ fluorescence (or reflectance) and appears reminiscent of a scanning electron micrograph (Figure 3). The maximum brightness image is useful in illustrations (by combining it with the DEM) and also for locating bubbles in the casts. Additionally, a maximum brightness image can be used for verifying that the signal is neither too strong (the image is overexposed) nor too weak (the image has dark holes).
The quality of DEMs deteriorated visibly when the images were scanned at 200 µm intervals (Figure 4). We collected optical sections at the intervals of 50 µm except for very small teeth (< 1 mm) and larger teeth (> 6 mm) that were collected at intervals of 25 µm and 100 µm respectively. Digital Elevation Models containing surface irregularities (e.g., scratches) or noise (e.g., if the signal was low) can be smoothed for analysis of large surface features (e.g., slope angles).
It is worthwhile to note that while the image stacks can be quite large (up to 20 MB), the corresponding DEMs are small (typically under one MB). Thus, they can be easily stored.
 Visualization
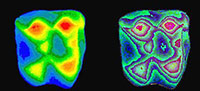
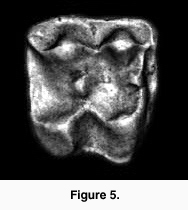
The DEMs are useful for illustrating tooth shapes. Additionally, DEMs and maximum brightness images of a tooth can be combined using 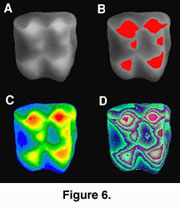 graphics software (e.g., Adobe Photoshop). However, DEMs are useful for analysis as their greyscale values correspond to height differences. This height information can be used to generate a three-dimensional reconstruction of the tooth. For example, using the Callisto Photoshop plug-in (Mac OS shareware by Kas Thomas) one can examine teeth from any angle. Moreover, Callisto facilitates overlay of the maximum brightness image on the rendered tooth, producing quite a realistic representation of tooth shape (Figure 5). In addition, the DEM's greyscale can be coded with false colors, aiding the examination of tooth topology (Figure 6), a procedure that also makes it easier to recognize landmarks for spatial measurement (or assigning DEMs to robust tooth shape categories such as crown types, see Jernvall et al. 1996).
Data Analysis and Geographic Information Systems
All traditional morphometric measurements (e.g., lengths, widths, heights, and angles) can be obtained from the DEMs. This can be done directly in NIH Image (or in 3Dview). For calibration of the crown height, we used the standard of a known height marked directly on the image stacks to calculate the amount of height difference (in µm) that each gray level value represented (i.e., two bright spots adjacent to each other but on different sections so that their height difference is 1 mm). It is useful to add blank sections to image stacks so that all teeth under study have the same number of sections. This enables one standard to be used to calibrate all the teeth. Measurements can be obtained using NIH Image macros to create the desired output files. For example, when gray level values are calibrated to be equal to xy distances, the following NIH Image macro gives the distance between two points in three dimensions:
macro 'Chord-distance [C]';
var
x1,x2,y1,y2,width:integer;
begin
SetUser1Label('Chord');
GetLine(x1,y1,x2,y2,width);
if x1<0 then begin
PutMessage('This macro requires a straight line selection.');
exit;
end;
Measure;
rUser1[rCount]:=sqrt(sqr(x1-x2)+sqr(y1-y2)+sqr(GetPixel(x1,y1)-GetPixel(x2,y2)));
UpdateResults;
end;
 Alternatively, only the xyz-coordinate locations can be recorded and used in calculations performed by other software. However, since the DEMs represent the "total shape data", they can be used to explore tooth shapes prior to the selection of measurements for further study. This is particularly important for small teeth, which may be quite difficult to examine in reflected light.
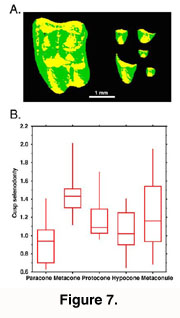
A recent approach to the analysis of tooth DEMs is to consider them analogous to geographical data (Reed 1997, Hunter and Jernvall 1998, Zuccotti et al. 1998). This enables the use of GIS software that often have powerful image analysis capabilities. Using appropriate GIS software tooth DEMs can be rectified (oriented) and various aspects of the tooth shape can be summarized. For example, by quantifying the areas of longitudinal and transverse slopes for each cusp, subtle differences in cusp selenodonty (elongation) can be measured (Figure 7). This kind of analysis would be difficult from landmark-based data because they would necessitate the detection of several "fuzzy" landmarks (Valeri et al. 1998). Also, the use of GIS software allows accurate measures of occlusal volumes to be made and subsequently to address more functional aspects of tooth shape.
PE Note: After publication an error was noted by the authors.
The text read: For casting, 100g resin, 45g hardener with accelerator (2 drops), and 0.5 ml of eosin solution were used.
The correct text should read: For casting, 100g resin, 45g hardener with accelerator (2 drops), and 2.5 ml of eosin solution were used.
That is, 2.5 ml of eosin should be used, not 0.5 ml.
DISCUSSION
The acquisition of dental DEMs with confocal microscopy offers several advantages over traditional specimen photographs. The most immediate benefit is the ability to visualize the morphology of small teeth or other small fossils. The DEMs also represent a permanent record of tooth morphology that can be stored and made available to the scientific community. Indeed, DEM representations of valuable museum collections could decrease the need to handle original specimens and thus lessen the risks of damage to specimens. Also, the confocal scanning method is well-suited for large sample sizes and facilitates detailed studies on variation within and among species in stratigraphically long sequences. The use of DEMs acquired with confocal microscopes in GIS (or perhaps more appropriately, Morphological Information Systems on Teeth, MIST) software allows new kinds of analyses to be undertaken that are less dependent on landmarks. Furthermore, use of dental DEMs and GIS for exploratory research could be useful in teaching as well as morphological research.
The most obvious limitations of DEMs is that they can be used to represent shapes that consist of one height value (z-value) for a given x-y pair. For example, tooth roots cannot be included within the same DEM as the crown. Similarly, some dental shapes are too convoluted for occlusal DEM representation (e.g., crabeater seal, Lobodon carcinophagus postcanines). One limitation with laser confocal microscopes is that they are designed for the study of very small specimens. For example, the confocal microscope available to us is only practical for teeth smaller than 10 mm when large sample sizes are required. Thus, the acquisition of DEMs from larger teeth require other techniques (e.g., Reed 1997, Zuccotti et al. 1998). However, the high-resolutions available with confocal laser microscopes makes possible the study even the smallest teeth in great detail. Obviously, in addition to small teeth, small features, such as microwear DEMs, also could be acquired with laser confocal microscopes (Boyde and Fortelius 1991).
ACKNOWLEDGMENTS
Jan A. van Dam, Mikael Fortelius, Oyvind Hammer, John P. Hunter, Han-Sung Jung, Merja Mäkinen, Qiu Zhuding, Riikka Santalahti and Irma Thesleff are gratefully acknowledged for their suggestions and help. We thank Helena Vihinen for helping with the confocal microscope and three anonymous referees. This work was supported by grants 39486 and 38355 from the Academy of Finland. This is a contribution from the Valio Armas Korvenkontio Unit of Dental Anatomy in Relation to Evolutionary Theory.
REFERENCES
Boyde, A. and Fortelius, M. 1991. New confocal LM method for studying local relative microrelief, with special reference to wear studies. Scanning, 13: 429-430.
Dryden, I., L. and Mardia, K., V. 1998.Statistical shape analysis. Wiley, New York. 347 pp.
Hamilton, D. K., and Wilson, T. 1982. Three dimensional surface measurement using the confocal scanning microscope. Applied Physics B, 27: 211-213.
Hunter, J. P. and Jernvall, J. 1998. Decomposing early morphological diversity in ungulates: analysis of early Paleocene arctocyonid teeth. Journal of Vertebrate Paleontology, 18: 52A.
Jernvall, J., Hunter, J. P., and Fortelius, M. 1996. Molar tooth diversity, disparity, and ecology in Cenozoic ungulate radiations. Science, 274: 1489-1492.
Lyons, P. D. and Head, L. 1998. QuickTime VR: A powerful new illustrative tool for micropaleontological research. Palaeontologia Electronica, 1: 12p., 219 KB. http://www-odp.tamu.edu/paleo/1998_2/lyons/issue2.htm
Marcus, L. F., Corti, M., Loy, A., Naylor, G., J., P. and Slice., D., E. 1996.Advances in Morphometrics. Plenum, New York, 587 pp.
Reed, D. N. O. 1997. Contour mapping as a new method for interpreting diet from tooth morphology. American Journal of Physical Anthropology, Supplement, 24: 194.
Valeri, C. J., Cole, T., M., Lele, S., Richtsmeier, J., T., 1998. Capturing data from three-dimensional surfaces using fuzzy landmarks. American Journal of Physical Anthropology, 107: 113-124.
Zuccotti, L. F., Williamson, M. D., Limp, W. F. and Ungar, P. S. 1998.Modeling primate occlusal topography using geographic information systems technology. American Journal of Physical Anthropology, 107:137–142.
