FIGURE 1. Photographs of fossil antilocaprid horns. 1.1, Ilingoceros schizoceras; 1.2, I. alexandrae; 1.3, Sphenophalos nevadanus.
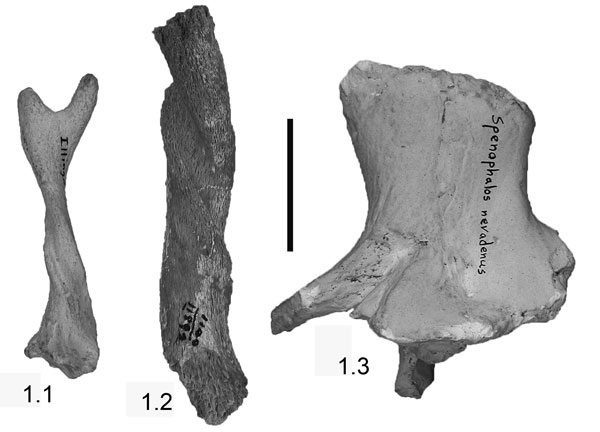
FIGURE 2. Illustration of idealized antilocaprid astragalus, indicating the eight dimensions used in this analysis, following DeGusta and Vrba (2003). 2.1, anterior view; 2.2, lateral View; 2.3, medial view. Abbreviations: LM= medial length; LI= intermediate length; LL= lateral length; TD= distal thickness; TI= intermediate thickness; TP= proximal thickness; WD= distal width; WI= intermediate width.
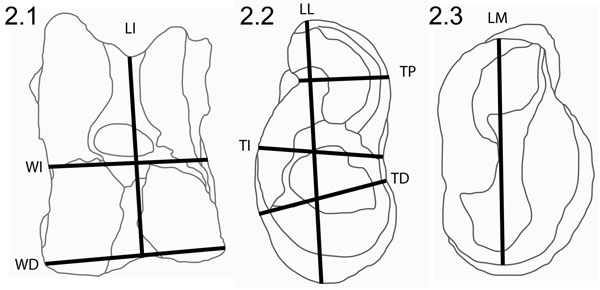
FIGURE 3. Principal components plots of Thousand Creek Antelope data. 3.1, PC1 versus PC2; 3.2, PC2 versus PC3.
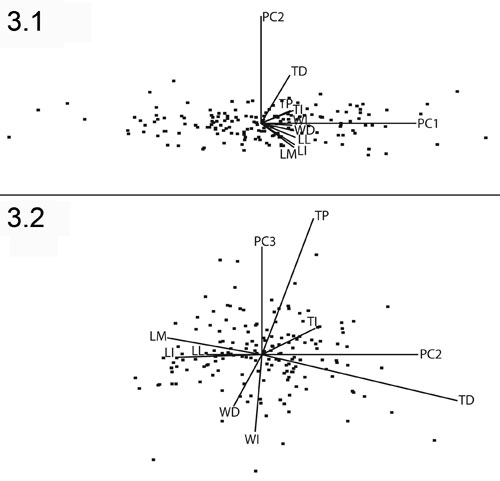
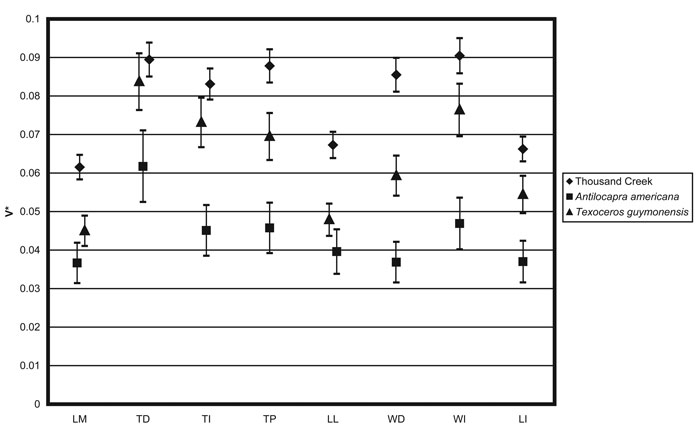
FIGURE 4. Comparison of values of V* for the Thousand Creek antilocaprids, Texoceros guymonensis, and Antilocapra americana. Vertical bars represent 95% confidence intervals.