FIGURE 1. Cross-section through the Emine-Bair-Khosar Cave (Vremir and Ridush, 2005).
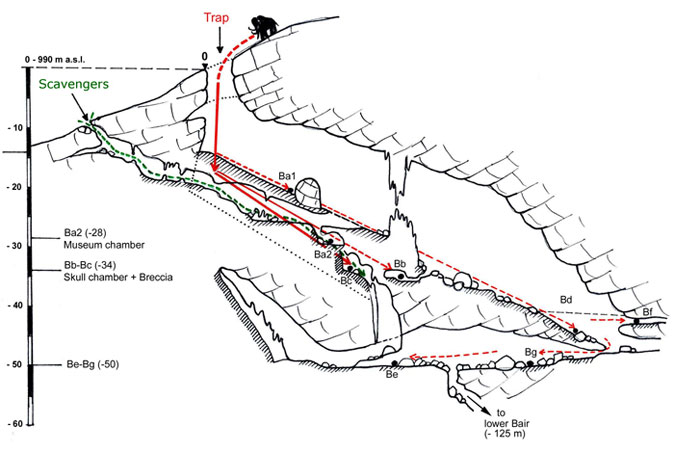
FIGURE 2. Terminology used to refer to particular dental traits.
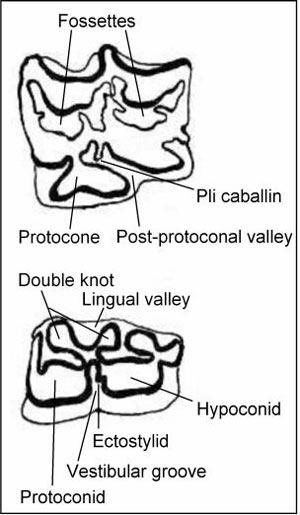
FIGURE 3.1. Skull no. Ba2 384 (photo E. van Asperen; scale in cm). FIGURE 3.2. Skull no. Bc 141 (photo P. Socha; scale in cm). FIGURE 3.3. Skull no. Bm001 (photo E. van Asperen; scale in mm).
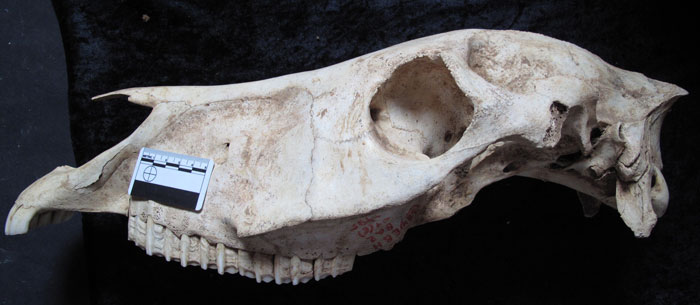
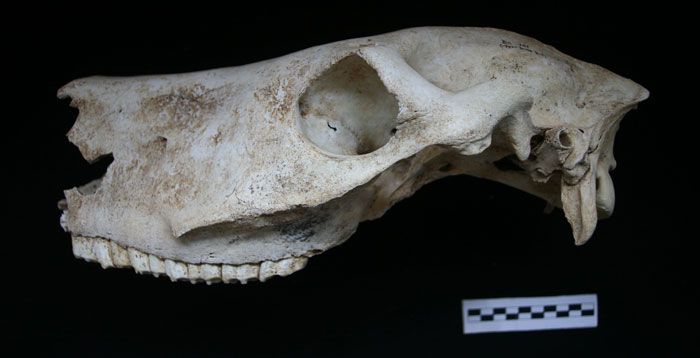
FIGURE 4. Log ratio diagram of measurements of the small EBK equid skulls compared with those of Equus hydruntinus.
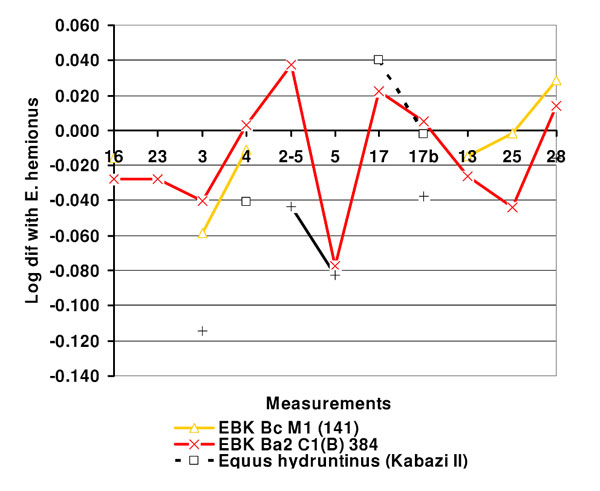
FIGURE 5.1. Log ratio diagram of measurements of the EBK equid longbones compared with those of extant and extinct equids; hum=humerus, fem=femur, rad=radius, tib=tibia, mc=metacarpus, mt=metatarsus, ph1a=anterior first phalanx, ph1p=posterior first phalanx, ph3=third phalanx; GL=greatest length, GB=greatest breadth. FIGURE 5.2. Log ratio diagram of measurements of the EBK equid longbones compared with those of extant and extinct equids; hum=humerus, rad=radius, fem=femur, tib=tibia; Bp=proximal breadth, SD=smallest breadth of the diaphysis.
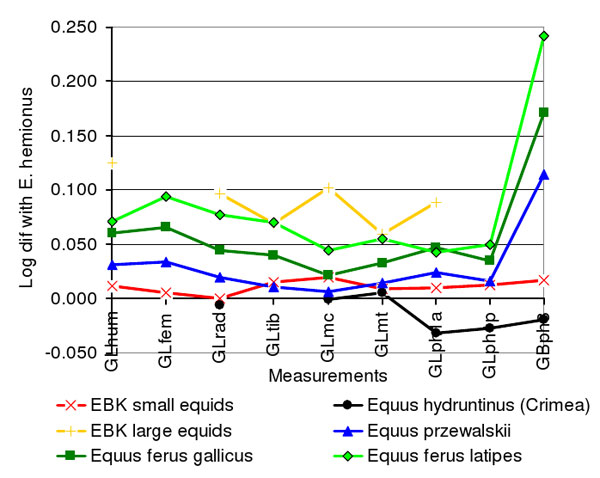
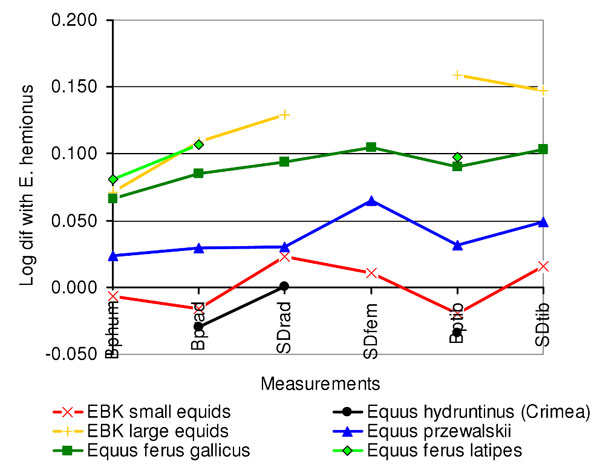
FIGURE 6.1. Log ratio diagram of measurements of the small EBK equid metacarpals compared with those of Equus hemionus, several E. hydruntinus samples and E. africanus. FIGURE 6.2. Log ratio diagram of measurements of the small EBK equid metatarsals compared with those of Equus hemionus, several E. hydruntinus samples and E. africanus. FIGURE 6.3. Log ratio diagram of measurements of the EBK equid anterior first phalanges compared with those of Equus hemionus, several E. hydruntinus samples and E. asinus. FIGURE 6.4. Log ratio diagram of measurements of the EBK equid posterior first phalanges compared with those of Equus hemionus, several E. hydruntinus samples and E. asinus.
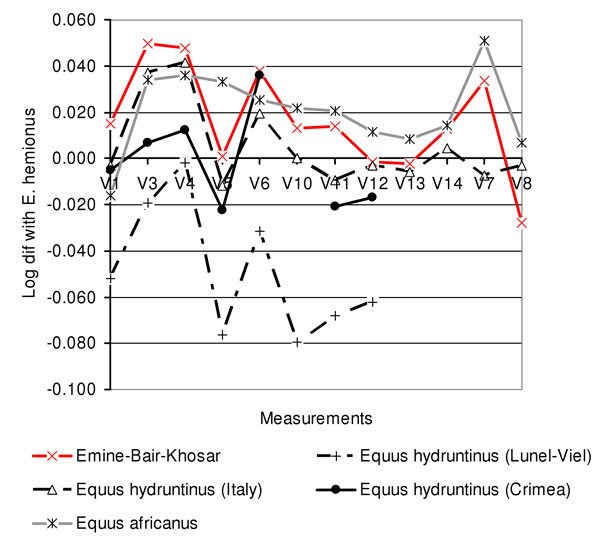
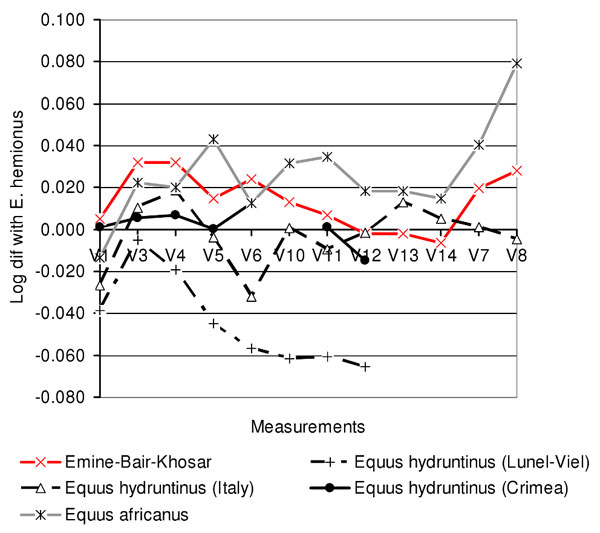
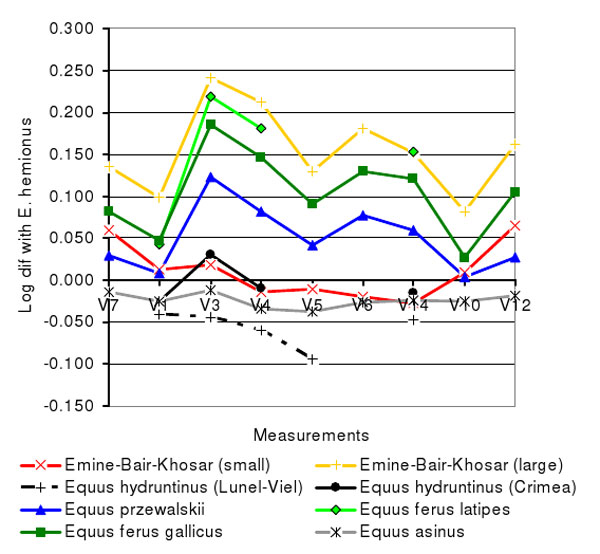
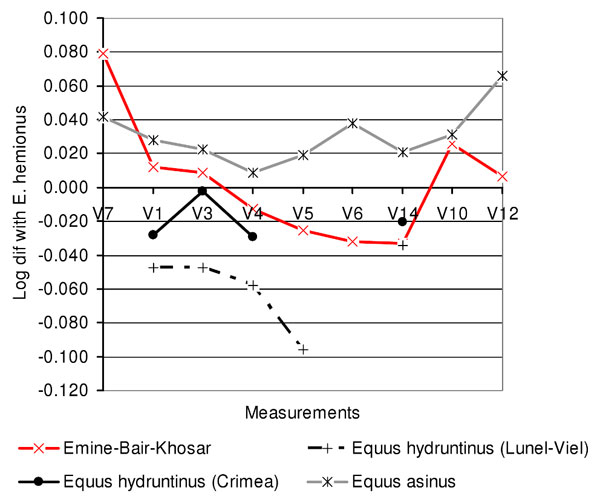
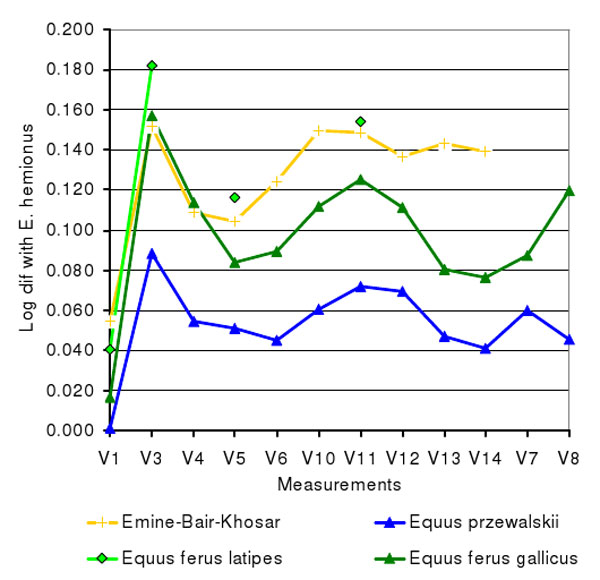
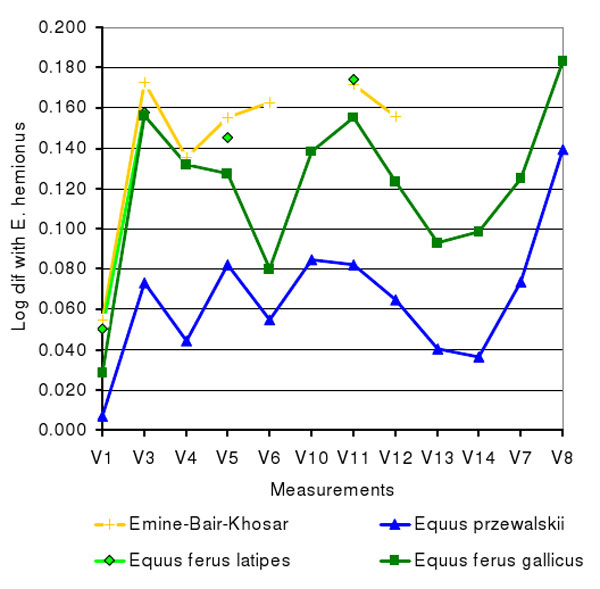
FIGURE 7. Log ratio diagram of measurements of the large EBK equid skulls compared with those of Equus przewalskii, Equus ferus gallicus and Equus ferus latipes.
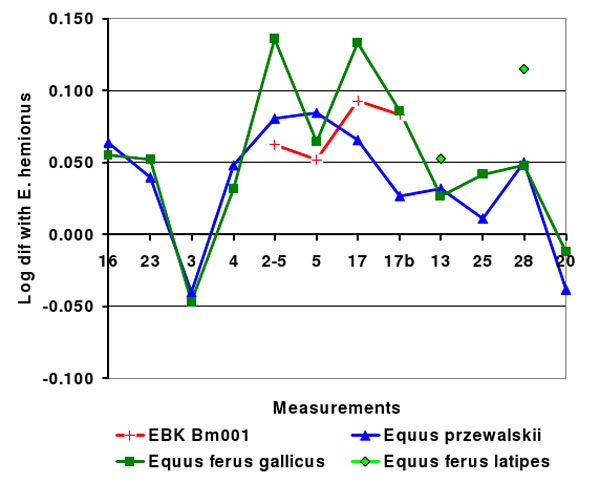
FIGURE 8.1. Log ratio diagram of measurements of the large EBK equid metacarpals compared with those of Equus przewalskii, E. ferus latipes and E. ferus gallicus. FIGURE 8.2. Log ratio diagram of measurements of the large EBK equid metatarsals compared with those of Equus przewalskii, E. ferus latipes and E. ferus gallicus.