 Error rates and observer bias in dental microwear analysis using light microscopy
Article Number: 15.1.12A
https://doi.org/10.26879/298
Copyright Society for Vertebrate Paleontology, March 2012
Author biographies
Plain-language and multi-lingual abstracts
PDF version
Submission: 25 May 2010. 24 November 2011.
{flike id=192}
ABSTRACT
Despite the increased use of light microscopy in microwear analysis, studies that recognize observer error are scarce. Nonetheless, microwear analysis based on light microscopy may be more prone to observer bias than SEM or confocal microscopy. We measured observer error among five observers, who independently analyzed identical sets of dental wear surfaces on digital micrographs taken through a light microscope. For experienced microscopists, error in light-microscope-based microwear was of a similar magnitude to error rates for SEM-based microwear methods. Significant intraobserver error was rare among the most experienced observers and higher among inexperienced observers. However, because observers develop familiarity when repeatedly analyzing the same image, intraobserver error measured here and in other similar SEM studies may be artificially low. Interobserver error was highly significant and did not appear to diminish with experience. Nonetheless, the data collected by all observers was highly correlated. Essentially all observers found similar microwear differences between the species analyzed, even though the absolute values in the data were observer dependent. Going forward, microwear results will be more robust if observers adopt methods that ensure observer blindness, and avoid the common practice of combining data from different observers, and even from one observer when the observarians are separated by time and experience. Rather than using pre-published microwear databases of extant species as a basis for interpreting paleodiet, researchers may be better served by building shared microwear image libraries, with which observers could generate their own data for the basis of making paleodietary inferences.
Matthew C. Mihlbachler. Department of Anatomy, New York College of Osteopathic Medicine at the NewYork Institute of Technology, Old Westbury, New York 11568 USA
Brian L. Beatty. Department of Anatomy, New York College of Osteopathic Medicine at the New York Institute of Technology, Old Westbury, New York 11568 USA
Angela Caldera-Siu. Department of Anatomy, New York College of Osteopathic Medicine at the New York Institute of Technology, Old Westbury, New York 11568 USA
Doris Chan. Department of Anatomy, New York College of Osteopathic Medicine at the New York Institute of Technology, Old Westbury, New York 11568 USA
Richard Lee. Department of Anatomy, New York College of Osteopathic Medicine at the New York Institute of Technology, Old Westbury, New York 11568 USA
KEY WORDS: dental wear; light microscopy; microwear; observer bias; observer error; paleodiet
Final citation: Mihlbachler, Matthew C., Beatty, Brian L., Caldera-Siu, Angela, Chan, Doris, and Lee, Richard, 2012. Error rates and observer bias in dental microwear analysis using light microscopy. Palaeontologia Electronica Vol. 15, Issue 1;12A,22p;
palaeo-electronica.org/content/2012-issue-1-articles/195-microwear-observer-error
INTRODUCTION
Dental microwear analysis is widely used for testing hypotheses about the diets and feeding behaviors of both living and extinct species. For example, dental microwear has provided a more complex picture of the diets of apes and early humans than can be revealed by craniodental morphology (Grine et al., 2006, 2010; Ungar et al., 2006, 2010). Other microwear studies suggest paleodiets that are in conflict with long-held views based on craniodental adaptations (Solounias et al., 1988; DeMiguel et al., 2008; Townsend and Croft, 2008; Billet et al., 2009), that the diets of some living species fluctuated in the recent geological past (Mainland, 2006; Rivals et al., 2007), and that some clades adopted a greater diversity of diets than observed in recent times (MacFadden et al., 1999; Semprebon and Rivals, 2007, 2010). Dental microwear also provides a means to test paleodietary hypotheses for long extinct species with no close living relatives and/or for extinct taxa whose craniodental adaptations are poorly understood (Purnell, 1995; Goswami et al., 2005; Joomun et al., 2008; ?si and Weishampel, 2009; Green, 2009; Semprebon et al., 2011; Homchaudhuri et al., 2010; Calandra et al., 2010; Whitlock, 2011). Dental microwear may also reveal novel aspects of paleodietary ecology, such as seasonal, regional, or inter-individual dietary variation (Merceron et al., 2010; Rivals et al., 2010).
While dental microwear is clearly a valuable paleoecological tool, paleodietary interpretations based on microwear data are vulnerable to error from numerous sources, including the morpho-functional differences in the feeding apparatuses of phylogenetically disparate species, food contaminants (such as sand or dust) that influence microwear (Ungar et al., 1995; Beatty, 2007), postmortem abrasion and erosion of fossil teeth (King et al., 1999), and other methodological inconsistencies, including inconsistencies in the specific tooth and wear facet chosen for analysis (Krueger et al., 2008; Ungar et al., 2010), variable cleaning/casting/molding methods (Galbany et al., 2006; Williams and Doyle, 2010), variable instrumentation settings, or inconsistent feature definitions (Gordon, 1988). Observer error, or more specifically, observer variation in the interpretation and measurement of microwear features, is potentially one of the more problematic aspects of dental microwear analysis (Grine et al., 2002; Purnell et al., 2006; Galbany et al., 2006).
In quantitative microwear analysis, microwear features (pits and scratches) observed on tooth surfaces that appear to represent discrete oral events are counted, measured, and categorized by size, shape, position, and/or orientation. Dental microwear has traditionally been analyzed via scanning electron microscopy (SEM) (e.g., Walker et al., 1978), and some researchers continue to use SEM methods for microwear analysis (Joomun et al., 2008; Galbany et al., 2009; Domonko?ová Tibenská et al., 2010). Beginning with Solounias and Semprebon (2002), many researchers have adopted light microscopy for dental microwear analysis (hereafter abbreviated as LDM) where, in comparison to traditional SEM methods, specimens are examined at lower magnification. Light microscopy has potential advantages over SEM for dental microwear analysis because it utilizes less costly and more accessible technology, is more time efficient, and potentially enables researchers to analyze many hundreds of specimens (Merceron et al., 2005a, 2005b; Nelson et al., 2005; Semprebon et al., 2004b; Solounias and Semprebon, 2002).
Solounias and Semprebon (2002) and Semprebon et al. (2004b) described a method where microwear data are recorded directly through a light microscope at low magnification (35x) without use of photography. Merceron et al. (2004, 2005a, 2005b) introduced a related method where microwear data are collected from digital micrographs taken through a light microscope at a similar magnification. There is no a priori reason to suspect either of these methods to be more observer error prone than traditional SEM methods. Regardless of the medium through which the microwear surface is viewed, the observer performs the same basic tasks, which involves identification and classification of irregularities on wear surfaces as different types of microwear scars (e.g., pits and scratches). Because traditional SEM methods and the LDM method described by Merceron et al. (2004, 2005a) utilize micrographs, and multiple observers can analyze the same micrographs, it is logistically easier to isolate observer error from other error factors, such as inconsistent instrumentation (lighting, in the case of light microscopy), specimen orientation, and variation in the specific areas chosen for analysis. It is logistically more difficult to isolate observer error from other error factors using the Solounias and Semprebon (2002) method, because it is exceedingly difficult for each observer to replicate lighting, specimen orientation, and identify the identical area on the tooth, and without photographs, it is impossible to evaluate the quality or equivalency of observer's data. Nonetheless, all of these methods are potentially vulnerable to the same error sources.
Studies of observer error in SEM microwear analysis have found that the magnitude of observer error is dependent on the experience and training of the observer but with low levels of observer error among the most experienced and highly trained observers (Grine et al., 2002; Galbany et al., 2005; Purnell et al., 2006). Based on these studies, some degree of observer error is also expected in LDM. Nonetheless, in the vast majority of LDM studies, observer bias is not considered. Moreover, numerous studies mix microwear data from multiple publications often from different observers with variable experience levels using methods that are not demonstrably identical (Rivals and Deniaux, 2003; Franz-Odendaal and Solounias, 2004; Semprebon et al., 2004b; Nelson, 2005; Boisserie et al., 2005; Green et al., 2005; Semprebon and Rivals, 2007, 2010; Rivals and Solounias, 2007; Rivals et al., 2007, 2008, 2010, 2011; Schultz et al., 2007; Townsend and Croft, 2008; Billet et al., 2009; Koufos et al., 2009; Peigne et al., 2009; Semprebon and Rivals, 2010; Solounias et al., 2010; Williams and Patterson, 2010; Firmat et al., 2011).
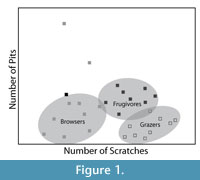 LDM studies of mammalian dental microwear are often aimed at discriminating three basic dietary categories, grazers, browsers, and frugivore/hard object feeders (Solounias and Semprebon, 2002). Grazer microwear is characterized by high scratch densities and low pit densities, browsers with low scratch densities and low pit densities, while frugivore-hard object feeders have intermediate numbers of scratches and greater frequencies of pits, particularly large pits (Solounias and Semprebon, 2002; Semprebon et al., 2004b). In a bivariate plot of pit and scratch frequency for extant herbivores, the data points form what has been termed a "trophic triangle" with the three different dietary categories forming the corners of the triangle (Figure 1) (Semprebon et al., 2004b). Solounias and Semprebon (2002), Semprebon et al. (2004b) and Merceron et al. (2005a, 2005b) have published datasets containing average scratch and pit counts for large numbers of extant ungulates and primates that demonstrate this triangular arrangement of diet as reflected by microwear data. Other studies commonly borrow these data to interpret the microwear patterns of fossil taxa, by either plotting the borrowed microwear data from extant species with microwear data of fossil species in bivariate space or some other form of statistical analysis (e.g., discriminant function) where data collected by multiple observers are combined.
At present, there is a deficiency of published studies that measure intra- and interobserver bias in LDM. Semprebon et al. (2004b) concluded that scratches and pits can be counted with great reliability by experienced microscopists using low-magnification microscopy. However, as dental microwear research becomes more widespread among researchers with varied degrees of expertise and training, the effect of observer bias has become a significant source of concern for paleodietary interpretations made from microwear data. A single published abstract (Scott et al., 2008) reporting a double blind concluded that LDM was more prone to interobserver error than SEM. It is not clear from the abstract if the higher error rate reported by Scott et al. (2008) for LDM is strictly a product of observer error or a mixture of observer error and other error, such as variable light, variable specimen orientation, or non-identical areas being analyzed by each observer. Up to this point, the published evidence does not sufficiently indicate whether or not observer bias is greater when light microscopy is used in comparison to SEM.
In this paper we measure observer-blind intraobserver and interobserver error rates in LDM. Five observers with variable amounts of prior experience independently analyzed several sets of digital micrographs of dental wear surfaces of species with varied diets, including browsers, grazers, and frugivore/hard object feeders. Intraobserver and interobserver error were analyzed iteratively as each observer gained experience and additional training and the ability of each observer to independently reproduce the classic "trophic triangle" pattern (Figure 1) was evaluated.
MATERIALS AND METHODS
Microscopy and Photography
M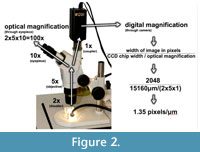 olding and casting of teeth for microwear analysis followed standard methods where dental wear surfaces were cleaned and molded with a polyvinylsiloxane compound and cast with clear epoxy resin. The casts were photographed under a Zeiss Stemi light stereomicroscope with an Insight Spot 4 megapixel camera (Figure 2). Typically dental microwear studies report the magnification at which dental wear surfaces are analyzed. However, when digital micrographs are used, optical magnification (e.g., 30x reported by Merceron et al., 2004, 2005a, 2005b) is less meaningful because the resolution of a pixilated digital photomicrograph is non-analogous to the magnification of an object viewed through the objective lens of a microscope. Merceron reported analyzing microwear on micrographs at resolutions of 300dpi and 1 pixel/μm (1 pixel/μm = 25,400 dpi in relation to the specimen). With our particular instruments, we were unable to produce either of these resolutions by photographing specimens at 30x or by photographing specimens when viewed at 30x.
Digital image magnification is calculated by the following formula: CCD chip size/(objective magnification x coupler magnification). With our particular instruments and instrumentation settings, each pixel represents an area of 0.74 μm 2 area in relation to the tooth surface being photographed (Figure 2). This digital resolution (1.35 pixels/μm ) is slightly higher than the 1 pixel/μm digital resolution reported by the above cited Merceron studies. The resulting resolution of the images is superficially similar to, but not analogous to, the resolution achieved by viewing the specimen directly at 100x through the eyepieces of the microscope and we were able to discern smaller scale microwear features than are visible with low magnification optical studies (e.g., 35x in Solounias and Semprebon, 2002).
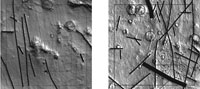
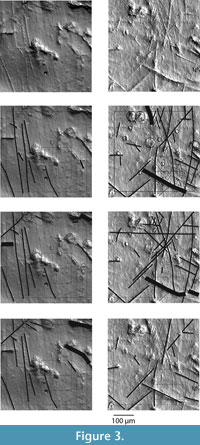 The clear casts were positioned on a glass stage and light was transmitted through the clear epoxy specimens by reflecting light from a white surface positioned 3 cm below the glass stage. This lighting protocol produces a high-contrast digital image that creates the illusion of a non-transparent surface superficially resembling an SEM image (Figure 3) similar in quality to images published by Merceron et al. (2004, 2005a, 2005b) and others who have adopted similar lighting methods (Schultz et al., 2007; Calandra et al., 2008; Billet et al., 2009; Goillot et al., 2009; Rodrigues et al., 2009; Ramdarshan, 2010). One of the challenges of photomicroscopy of dental microwear is achieving a horizontal orientation of the surface targeted for analysis. A horizontal orientation is required to eliminate distortion of the area in which microwear is counted and distortion in the shapes of microwear features. The narrow depth of field resulting from the magnification at which we were photographing specimens allowed minimal variance in the tilt of the wear facet of interest and only allowed for photography of flat surfaces. During the casting process, we attempted to orient the cast so that the wear surface of interest was horizontal when the specimen was placed on the microscope objective. Because dental wear surfaces are often irregularly angled and are not perfectly flat surfaces, casting the wear surface with the correct orientation was an imperfect process. Most specimens required a slight amount of tilting under the microscope so that the surface of interest was sufficiently horizontal for achieving a focused image. However, tilting the specimen more than a few degrees significantly diminished the amount of light passing through the specimen and undermined the desired lighting effect. Specimens requiring excessive tilting were recast with slightly different orientations until the correct lighting conditions could be achieved. Specimens were rejected if the desired image quality could not be achieved or when the target wear surface appeared to have post-mortem artifacts. We found specimens with no evidence of post-mortem contamination to be rare. Numerous images that we accepted for analysis showed some contamination (e.g., bits of dust that had been cast with the specimen, small cracks, or remaining chemical residues). When post-mortem artifacts covered a significant portion of the area of interest or appeared to obscure the microwear in a significant way, the specimen (or micrograph) was rejected.
Image Analysis
The resulting grayscale 2048 x 2048 pixel TIF images were cropped to a much smaller 608 x 608 pixel image, and, using the "levels" feature in Adobe Photoshop, were enhanced so that the darkest pixel in the image was black and the lightest pixel in the image white. The 608 x 608 pixel area was generally cropped from the center of the full image, or if post-mortem artifacts occupied the center of the image, as close to the center as possible. Cropping the images prevents the observer from seeing any more than a few tens of microns beyond the area specified for analysis, guaranteeing blindness toward the taxonomic identity of each image. A larger square and a smaller grid with four sub-squares were superimposed over the 608 x 608 pixel images (Figure 3). The large square measures 533 pixels by 533 pixels and covers a physical area of the tooth surface measuring 400 μm x 400 μm (1.6 x 105 μm 2). This is the same area analyzed by Solounias and Semprebon (2002) and Semprebon et al. (2004b). The smaller grid covers an area 200 pixels x 200 pixels and surrounds a physical area of 150 μm x 150 μm (2.25 x 104 μm 2 ) of tooth surface. The cropped and enhanced images and interpretations are available online (www.nyit.edu/nycom/research/microwear).
To interpret the microwear images, all observers used the same computer and digital display but worked independently at different times. The images were viewed on a 100dpi Apple computer display at 100% resolution (1 image pixel per 1 display pixel) or higher. Microwear features were categorized based on their physical dimensions, using Adobe Illustrator, where each observer essentially traced their interpretation of the microwear using a standardized series of circles (to mark pits) and lines (to mark scratches) of predefined diameters and widths (Figure 3). In addition to marking microwear features, the standardized labeling features were used to determine the size category of each microwear feature. These labeling features were initially drawn to correct scale using the image of a micrometer photographed under the microscope at the same resolution as the microwear images (1.35 pixels/μm ). During the process of analysis, the images were presented to each observer in randomized order. However, observers were allowed to examine images more than once to correct misidentified features or count previously missed features. For each iteration, analyses continued until each observer was satisfied that their analysis of each image was exhaustive and accurate.
Microwear Feature Definition
Pits were defined as having a maximum/minimum diameter less than four. More elongate features were considered scratches. Pits and scratches were further subdivided into 3 size categories based on maximum diameters (pits) and maximum widths (scratches). Pit size categories were ≥5-<20 μm , ≥20-<50 μm , and ≥50 μm . Scratch width categories were <5 μm, ≥5-<20 μm, and ≥20 μm. It turned out that comparatively few microwear features were assigned to the largest pit and widest scratch categories, and these were combined with the intermediate pit and scratch size categories in the statistical analysis reported below. These features are collectively referred to as wide scratches and large pits. Wide scratches and large pits were labeled and counted within the larger 400 μm x400 μm area, including features that overlapped any part of this area, but not entirely enclosed by it. The smallest pit and narrowest scratch categories are referred to as narrow scratches and small pits. These were far too numerous to exhaustively label in the larger counting square and were only recorded when they were enclosed by the smaller 150 μm x 150 μm grid or overlapped some part of it. Most of these smaller features may be smaller than microwear features typically recognized in other studies. Pits less than 5μm diameter were observed in the images but were ignored. One microwear study (Rodrigues et al., 2009) performed at 100x found pits less than 5 μm diameter to be relatively uninformative of diet; however, we simply excluded pits below 5 μm because the resolution of our images limited clarity of pits below this size. Scratches, because of their more elongate nature, did not seem to pose a similar limiting problem, and the smallest visible scratches were labeled and counted.
 Incremental Training and Experience
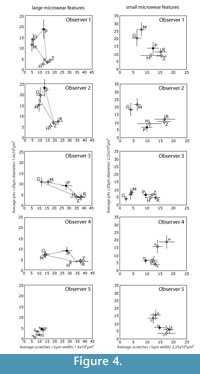
Two of the five observers (Obs 1-2) had prior exposure to dental microwear analysis. Among those two, Obs 1 had more initial experience with the specific methodology used here. The remaining three (Obs 3-5) had no prior exposure to dental microwear of any kind. Additionally, Obs 2-5 were unaware of which species had been included in the study. Observer 1 compiled the images and was therefore aware of the species included, however the order of the images was randomized so that none of the observers, including observer 1, were aware of the taxonomic identity of any single image during analysis. All five observers examined three sets of images (iterations 1-3). An additional fourth iteration was run with only observers 1 and 2. Training and experience were increased with each iteration. The image sets for each iteration were taken from a variety of ungulate species but always included at least one species from each of the three main dietary groups: frugivore/hard object specialist, leaf browser, and grazer (Figure 4, Figure 5). New images were chosen for each iteration to eliminate the possibility of developing familiarity with the images, which might have caused an artificial iterative reduction in observer error. However, to investigate intraobserver error during iterations 1-3, a series of 10 repeated images were randomly mixed into the larger set of images during each iteration. We had hoped that mixing the repeated images in with larger sets of unique images would have prevented the observers from recognizing the repeated images. However all five observers recognized some of these repeated images by the third repetition.
Prior to running iteration 1, Obs 2-5 were provided with a tutorial, written by Obs 1, explaining the procedures for analyzing the images. Following iteration 1, Obs 2-5 participated in a training session led by Obs 1, where the identification of microwear features was demonstrated, the importance of consistency and thoroughness was discussed, and several practice images were interpreted and labeled based on group consensus. Following this training session, iteration 2 was run. Following iteration 2, an additional training session was run. Iteration three followed the second training session. Approximately 4 months later, observers 1 and 2 participated in the fourth iteration without additional training sessions.
The number of images was increased with each iteration to address additional questions. Iteration 1 included 18 images and was aimed at testing the initial error rate. Iteration 2 included 42 images, allowing the observers with no prior training to accumulate more experience. Iterations three (80 images) and four (75 images) involved many more images to address additional questions about species-specific or diet-specific observer error rates. The final iterations (3 and 4) also addressed concerns about the effect of observer fatigue that may occur when large numbers of specimens are analyzed.
 Statistical Analysis
Statistical analyses of five variables are reported: the number of small pits counted in the 150 μm x 150 μm area, the number of narrow scratches in the 150 μm x 150 μm area, (3) the number of wide scratches in the 400 μm x 400 μm area, (4) the number of large pits in the 400 μm x 400 μm area and (5) the sum total of wide scratches and large pits in the 400 μm x 400 μm area.
ANOVAs and paired t-tests were used to test for differences in the mean numbers of microwear features recognized. Following the ANOVAs, a series of post hoc tests were run to determine which of the intraobserver and interobserver comparisons were significant. Following Grine et al., (2002), two post hoc test methods were used: the least significant difference (LSD) test (which assumes homogeneity of variance), and the Games and Howell (GH) test, which does not involve the assumption of homogeneity of variance. Pairwise interobserver and intraobserver comparisons were also made with paired t-tests. Paired t-tests are a more powerful means of discerning significant differences in means compared to ANOVAs. However, because each pairwise test is independent, excessive numbers of paired t-tests introduce a greater risk of type 1 error (falsely rejecting the null hypothesis), therefore it is likely that while ANOVA slightly underestimate the frequency of significant tests, the paired t-tests slightly overestimate the frequency of significant tests.
In addition to testing for significant differences in the mean numbers of microwear features recognized, we also tested for significant interobserver and intraobserver correlations that examine the possibility that even though observers do not consistently recognize the same numbers of scratches and pits, they may still recover correlated results. Pearson correlation coefficients (PCCs) were calculated to evaluate the degree of correlation between the observers and within observers for repeated images. For intraobserver correlations, PCCs were only calculated for comparisons of adjacent iterations (iterations one and two and iterations two and three). These specific comparisons were made to determine the impact of increased training and experience on the ability of each observer to recover correlated data in subsequent iterations. We do not report intraobserver correlation between iterations one and three.
RESULTS
Intraobserver Error
ANOVA and paired t-test results for the 10 repeated images suggest that observers often counted significantly different numbers of microwear features during successive iterations. A total of 25 intraobserver ANOVAs were possible (5 observers x 5 variables) (Table 1). Nine out of 25 (36%) of these tests were significant. Post hoc tests were run to determine which specific intraobserver comparisons between iterations 1 and 2 and between iterations 2 and 3 were significantly different. Out of 50 post hoc tests (5 observers x 5 variables x 2 pairs of iterations = 50 tests.), 11 post hoc tests (22%) were significant (Table 2). The more powerful paired t-tests identified 20 (40%) significant intraobserver differences out of the same 50 possible comparisons (Table 3). Only a single instance of significant intraobserver error was found among the experienced observers (for the wide scratch data from Obs 2). Most of the significant intraobserver error occurred among two of the inexperienced observers, Obs 3 and 4. Obs 4 showed no sign of iterative improvement and for Obs 3, intraobserver error increased substantially between iterations 2-3. No significant intraobserver error was detected for one of the inexperienced observers (Obs 5).
Significant Pearson correlation coefficients (PCC) of the intraobserver comparisons are indicated in Table 4. Between iterations 1 and 2, only 9 out of 25 (36%) possible intraobserver comparisons were significantly correlated, whereas between iterations 2 and 3, 19 out of 25 (76%) intraobserver comparisons were significantly correlated. All five observers showed higher overall PCCs with increased training and practice. Among the two experienced observers (Obs 1 and 2) all of the correlations were significant between iterations 2 and 3. However, among the inexperienced observers, several PCCs were still quite low and insignificant between iterations 2 and 3.
To summarize, the intraobserver error tests indicate that more experienced observers more often have lower and mostly insignificant rates of intraobserver error, in comparison to observers with lesser amounts of experience. Although inexperienced observers commonly counted significantly different numbers of microwear features with each successive iteration, the improvement in intraobserver error indicates each observer was collecting higher quality data with each successive iteration. However, it is worth noting that intraobserver error may be underestimated here and in other similar studies (Grine et al., 2002; Galbany et al., 2005, Purnell et al., 2006) because the observers developed familiarity with the repeated images.
Interobserver Error
Out of 15 possible ANOVAs testing for differences between the observers (five variables x three iterations) all were highly significant (P≤0.05). Table 5 includes the results of the post hoc tests following the ANOVAs. For each iteration there were 50 possible post hoc comparisons. Depending on which post hoc method is used (LSD or GH), 44%-80% of these post hoc tests indicate significant differences in the numbers of microwear features recognized by different observers. If interobserver error had decreased with successive iterations, we would have expected the number of significant interobserver differences to have decreased with each iteration. However, we found this not to be the case; the frequency of significant tests was actually highest for iteration 3. To evaluate the distribution of error rates among experienced and inexperienced observers, the results of paired t-tests comparing Obs 1 with the other observers for iteration 3 are seen in Table 6. Out of these 20 tests, 16 (80%) were significant. The distribution of significant interobserver comparisons had little relationship to experience. Obs 1 and Obs 2, the most experienced observers, counted significantly different numbers of features for three out of the five microwear variables. Comparisons of Obs 1 with the inexperienced observers were only slightly worse, significance differences were found in 4-5 out of five microwear variables for each paired test.
The number of significant Pearson correlation coefficients out of 50 possible pairwise interobserver comparisons for each iteration are reported in Table 7. The results of paired comparisons of Obs 1 with the remaining observers are shown in Table 8. It is clear from both Table 7 and Table 8 that interobserver correlation was initially very poor. Only 17 out of 50 (34%) of the iteration 1 interobserver comparisons were significantly correlated (Table 7) with average correlation coefficients ranging from 0.33-0.49 (Table 7). There was an immediate improvement during iteration 2 with 50 out of 50 significant correlations (100%) (Table 7), with average correlation coefficients ranging from 0.60-0.82 (Table 8). Interobserver correlation was similar during iteration 3, although slightly diminished with 49-50 (98%) significant interobserver correlations and average correlations coefficients ranging from 0.54-0.74. Experience with dental microwear seemed to have no relationship to the degree of correlation. For example during iteration 1, correlation between Obs 1 and 2 is as poor (or worse) than correlation of Obs 1 with Obs 3-5. The dramatic improvement in interobserver correlation in subsequent iterations was equally strong among experienced and inexperienced observers.
To summarize the results of the interobserver error tests, all observers had difficulty recognizing the same numbers of dental microwear features. Neither the prior experience of the observers nor the experience accumulated iteratively during this study seemed to effect the ability of observers to recognize, on average, the same numbers of microwear features. However, it is clear that with a small amount of initial practice (iteration 1) all observers quite easily recovered significantly correlated results, meaning that they tended to recognize similar relative differences between microwear images. The prior experience of the observers and the experience iteratively accumulated during this study did affect the degree of interobserver correlation.
Diet-Specific Error Rates
We were concerned that the magnitude of observer error might be influenced by different microwear surface textures related to different diets. For example, it is possible that observer error rates for highly pitted dental wear surfaces of hard object feeders could be systematically different than the more heavily scratched wear surfaces of grazers. To test for such diet-specific effects on observer error, observers 1 and 2 participated in a final fourth iteration consisting of 75 unique and randomly ordered mages (15 images for each of five species), including Equus burchelli (grazer), Giraffa camelopardalis (a browser), Tayassu pecari (a hard object feeder), an extant tapir, Tapirus terrestris (a browser with significant frugivory), and one extinct late Pleistocene tapir, Tapirus veroensis from Aucilla River, North Florida (Webb and Simons, 2006).
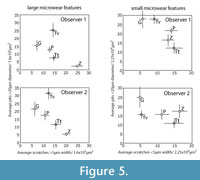
Judging from the species-combined data (bottom of Table 9), like the earlier tests, the observers were successful at recovering significantly correlated results, but there were often significant differences in the numbers of microwear features counted. However, significant interobserver correlation was harder to achieve when species were examined individually. Six out of 25 species-specific interobserver comparisons were insignificantly correlated, probably because the overall variance in the microwear data for each single species is lower than the entire species-combined sample. The results of the species-specific analyses do not indicate any clear species-specific trends in the magnitude of observer error (Table 9). Pearson correlation coefficients were significant for all five variables from data derived from giraffe and extant tapir, although these species have dissimilar microwear patterns (Figure 5). For the remaining taxa, including the extinct tapir, peccary, and zebra, some of the microwear variables were not significantly correlated (Table 9). ANOVAs found three (12%) significant differences out of 25 possible comparisons, whereas the more powerful paired t-tests found 10 (40%) significant differences with 1-3 significant tests per taxon. Obs 1 and 2 failed to recover correlated results most frequently for scratch variables, however, a greater number of significant differences in means were found in the comparisons of large pit data. These results do not seem to pinpoint any particular dietary category or microwear variable as being more error prone than any other, and it seems reasonably safe to conclude that differences in the rate of error were randomly distributed throughout the variables through all four iterations. Based on these data, we are unable to conclusively pinpoint any particular microwear variable or any particular species or type of diet as being more error prone than any other.
Mean Absolute Percentage Differences (MAPD)
To compare our results more directly to the results of Grine et al. (2002), we also calculated the mean absolute percentage difference (MAPD) values (observed value - sample mean) (100) / (sample mean). In this case, each MAPD value is the average value for a particular microwear variable generated by an observer during an iteration. Grine et al. (2002) and Galbany et al. (2005) reported MAPD values for interobserver comparisons that hovered around 10%. However, when all five observers participating in this study were considered, the resulting MAPD values for iteration 1 were quite high with a much higher average MAPD value (45%) (Table 10). However, the resulting MAPD values decreased with each successive iteration, indicating that as experience accumulated, the percent differences between each observer decreased. By iteration 3, MAPD values had been nearly halved (28% average). However, three iterations was not sufficient to achieve the much lower (~10%) MAPD values reported by Grine et al. (2002) and Galbany et al. (2005). However, MAPD values calculated from comparisons of the two observers with prior experience (Obs 1 and 2) (Table 11) were considerably lower for all iterations and for iterations 2, 3, and 4 the average MAPD values per iteration ranged between 8-12%. These values are similar to the range of MAPD values reported by Ungar et al. (2002), indicating that interobserver error rates for the method used here are not substantially different than SEM studies.
Repeatability of the 'Trophic Triangle'
Figure 1 shows the "trophic triangle" of ungulate microwear. Figure 4 shows species averages and standard errors for all five observers for iteration 3. In plots of the larger microwear features (large pits and wide scratches), four of the five observers (Obs 1, 3 and 4) recovered species clusters more or less resembling the trophic triangle with giraffe and moose forming a browser cluster, and zebra and hippo forming a grazer cluster with the peccary representing the frugivore-hard object feeder. Obs 2 did not successfully differentiate the hard object feeder from the browsing species but otherwise produced similar results. Obs 5, on the other hand, produced results that were very different from the other observers. The trophic triangle pattern was not recovered by any of the observers in the bivariate plots of the small microwear features (small pits and narrow scratches) suggesting that the trophic triangle pattern may largely be a phenomenon of larger microwear features. However, all observers, including Obs 5 recovered the same two clusters of species, a browser cluster and a hard object feeder-grazer cluster. Although most observers recovered the same sets of species clusters for iteration 3, or nearly recovered these clusters, the positions of these species clusters varied dramatically in bivariate space, with the most experienced observers (Obs 1 and 2) recovering similarly positioned species clusters. Obs 3 and 4 recovered similarly positioned clusters with large pits and wide scratches, but not with small pits and narrow scratches. Data from Obs 5 plotted differently from the others. One unanticipated and particularly interesting result was the unanimous misclassification of the browsing black rhino (Diceros bicornis) as a grazer.
Data from Obs 1 and 2 from iteration 4 are plotted in Figure 5. A triangular arrangement of diets was not as apparent in these data, however, Obs 1 and 2 positioned each species very similarly in bivariate space in the plots of large pits and wide scratches, but not for small pits and narrow scratches. These results also suggest observers had a much more difficult time consistently recognizing microwear differences among smaller microwear features. The inclusion of the fossil tapir (Tapirus veroensis) tests the ability of two observers to generate similar conclusions about the microwear of an extinct species of unknown diet. Regardless of interobserver differences in these data, both observers found the extinct tapir to plot similarly with respect to the extant species, with many more large pits than any of the extant species examined and with a microwear distribution of small microwear features intermediate between giraffe and peccary.
DISCUSSION
Comparison of Results to SEM Error Studies
Grine et al. (2002) found observer error rates to be statistically insignificant with intraobserver percentage differences around 7% and interobserver percentage differences around 9% on average for SDM. These error rates, at first, seem low in comparison to our own results which suggest higher rates of observer error for LDM, with many statistically significant interobserver and intraobserver differences. However, the small number of images analyzed by Grine et al. (2002) (N=2-4) may not have been statistically adequate. The MAPD calculations used by Grine et al. (2002) are sensitive to the numbers of observers and the magnitudes of the measured variables (Galbany et al., 2005). More importantly, Grine et al. (2002) measured error only among highly experienced observers whereas our study and others (Galbany et al., 2005; Purnell et al., 2006) included observers with lower amounts of initial experience. While we found observer error rates to be initially quite high among all observers, and after some initial practice, the two most experienced observers of our study (Obs 1 and Obs 2) were able to achieve error rates that were insignificant most of the time with interobserver percentage differences that were only slightly higher than those of Grine et al. (2002). Other SDM observer error studies found results similar to our own, with statistically significant interobserver error rates, lower intraobserver rates, and a strong relationship between the magnitude of error and observer experience.
These other observer error studies entailed repeated analysis of a small number of images (N= 2-10) (Grine et al., 2002; Galbany et al., 2005;, Purnell et al., 2006), and it is therefore possible these studies underestimate typical observer error rates. In the intraobserver error portion of the Grine et al. (2002) study, one observer repeatedly analyzed two micrographs. Galbany et al. (2005) analyzed four images with four repetitions. Purnell et al. (2006) analyzed 10 images with five repetitions. Typical microwear studies involve more than 10 specimens, and observer fatigue may have a diminishing effect on observer precision, accuracy, or thoroughness. Additionally, because these studies involved repeated examination of 10 or fewer images, the observers are likely to have developed a degree of familiarity with the individual images, and even specific microwear features within the images, with each repetition, leading to an artificially high degree of observer precision. Even during our study, in which 10 repeated images were randomly mixed with large numbers of unique images, we were able to recognize many of the repeated images by the third repetition, suggesting that intraobserver error rates calculated in all of these studies may be artificially low.
Are Different Kinds of Microwear More Error Prone Than Others?
Studies of observer error in microwear entail the comparison of quantitative data pertaining to a sample of objects rather than individual objects (i.e., any single pit or scratch) (Grine et al., 2002), and each micrograph comprises a separate statistical sample of microwear features, possibly with its own unique potential for error. Previous studies conclude that the magnitude of observer error is influenced substantially by the nature of the micrograph being measured (Grine et al., 2002; Galbany et al., 2005; Purnell et al., 2006). Although the larger number of images analyzed in this study prohibited reporting error rates for individual micrographs, we did find, like previous studies, that observer error rates varied substantially from micrograph to micrograph. We considered the possibility that micrograph-specific variation in the magnitude of observer error was associated with the differing relative frequencies of certain types of microwear features that may be more error prone than other kinds of microwear features. For instance, if scratches are more observer error prone that pits, researchers might have a more difficult time identifying microwear patterns associated with diets, such as grazing, that are characterized by high scratch densities. However, we could find no strong evidence that micrograph-specific variation in the degree of observer error was anything but stochastic. The distribution of statistically significant error appears to be randomly distributed with respect to the five microwear variables that we analyzed. Visual inspection of the data (Figure 4, Figure 5) suggests that observers had more difficulty producing consistent overall patterns among the smaller microwear features (small pits and narrow scratches). Analysis of species-specific observer error during iteration 4 did not locate any clear systematic differences in the magnitude of error for different species, suggesting that different microwear patterns associated with different types of diets are similarly prone to observer error.
Relevance of Results to Prior Dental Microwear Studies
One of the differences between this study and other LDM studies is magnification and/or image resolution. Magnifications reported for LDM studies are varied. Solounias and Semprebon (2002) and studies following their method analyze microwear at 35X. Nelson et al. (2005) used 70X and Rodrigues et al. (2009) and Firmat et al. (2011) used 100X for small mammals. Merceron et al. (2004, 2005a, 2005b) and others following their method analyzed digital micrographs that were reportedly taken at a magnification of 30X with an image resolution of 1 pixel per micron, a resolution that is only slightly lower than our resolution (1.33 pixels per micron). In a separate study, two of us (OBS 1 and 2) repeatedly analyzed a series of 30 images as image resolution was iteratively reduced to test the effects of resolution reduction in LDM (Mihlbachler and Beatty, 2011). In this study, observers identified fewer numbers of microwear features at lower resolutions, however the magnitude of interobserver error was similar at all resolutions down to about 0.27 pixels per micron, and we were able to discern the same relative differences between species down to the lowest resolution attempted, 0.067 pixels per micron (5% of the resolution used here). This suggests the specific magnification or resolution isn't important as long as data included in a single analysis were collected at a consistent magnification and/or resolution.
We initially attempted to test the most commonly utilized LDM method (Solounias and Semprebon 2002), where specimens are analyzed directly through the lenses of the microscope, without photomicrographs. While the 3D perspective afforded by the live stereo view may seem advantageous in comparison to a 2D micrograph (Semprebon et al., 2010), we encountered considerable logistical difficulties in attempting to adopt this method. For instance, without micrographs, observers cannot preserve their individual interpretations of wear surfaces. It is necessary for each observer to independently position the specimen under the microscope, rendering it exceedingly difficult for different observers to achieve identical lighting, identical specimen orientation, or even to analyze the identical area on each specimen. Finally, observer blindness to the taxonomic identity of the specimens is not maintained when microwear is quantified directly from the specimen under the microscope. These logistical complications render it very difficult to isolate the observer from other potentially biasing factors. The inability to mark or label the individual microwear features likely compromises accuracy, particularly on wear surfaces where microwear features are densely distributed with numerous pits and/or overlapping scratches of varied lengths and orientations. Accuracy, precision, and thoroughness are likely to be improved when microwear features are individually labeled or traced on a micrograph, so that no recognizable feature is missed or counted more than once. If the interpretation is superimposed over the micrograph, the observer (or anyone else) is able to revaluate each interpretation, correct mistakes, eliminate inconsistencies, and estimate the overall quality of the data. The ability to inspect and reevaluate one's interpretations may also eliminate the effect of observer fatigue on diminishing observer precision, accuracy, or thoroughness.
Microwear variables are typically defined by shape (pits and scratches) and size (large and small or coarse and fine) criteria, however, it is logistically difficult to categorize microwear features according to standardized physical dimensions when specimens are examined directly under the microscope. Rather, it is up to the observer to determine if a pit, for instance, is large or small, or if a scratch is fine or coarse. Semprebon et al. (2004b) suggest that these types of microwear features can be readily identified by their refractive properties. However, the refractive appearance of a microwear feature is a function of both the shape of the microwear feature itself, the orientation of the light, and the overall shape of the specimen. However, subtle changes in light orientation have significant effects on the refractive appearance of microwear features. Comparisons of the images that are published in microwear papers, suggest that microscopists use varied lighting regimes and mix data from fossil species with data from extant species that were collected with inconsistent lighting regimes (Semprebon et al., 2004a, 2004b, 2011; Rivals et al., 2007; Semprebon and Rivals, 2007, 2010; Townsend and Croft, 2008; Green, 2009). Whether or not the varied lighting regimes are being used for data collection or for photographic purposes only is not clearly reported.
One of the most problematic aspects of nearly all published LDM studies is ambiguity about observer blindness. Blindness toward the taxonomic identity of the specimens is logistically easiest when micrographs are used; the micrographs of multiple taxa can be randomly shuffled. Although the problem is perhaps not insurmountable, maintaining observer blindness is logistically more difficult when microwear is quantified under the microscope, because the observer must position the specimen under the microscope and obviously will have some knowledge of the identity of the specimen. Similarly, additional microwear visible outside of the target counting area may influence how the microwear is interpreted.
Solounias and Semprebon (2002) defined scratch density ranges, in terms of scratch counts per 400x400 μm area, for extant browses and grazers (0-17 scratches for browsers, and 17.5-29.5 scratches for grazers). With knowledge of the taxonomic identity of the specimen, any prior information about diet (for extant taxa) or hypotheses about diet (for extinct taxa) may influence the observer's tendencies in recognizing microwear features as pits or scratches. In the same vein, observers may exercise different criteria for choosing the specific area on a particular occlusal facet on which microwear is to be quantified. For instance, an observer might be more inclined to choose an area with a high scratch density for a grazer but might be more inclined to choose an area with a lower scratch density for a browser. In our study, only three of the five taxon-blind observers were able to reproduce three distinct dietary groups forming the corners of the classic trophic triangle pattern of ungulate microwear (Figure 5) and, even though the positions of these groups varied considerably in bivariate space we seem to have been able to verify that the "trophic triangle" arrangement is repeatable. However, all five observers unanimously miscategorized the microwear of the browsing black rhino (Diceros bicornis) as a grazer. While this miscategorization speaks well for interobserver consistency when the observers are blind, similar contradicting microwear patterns are rarely reported in the literature.
In Semprebon et al. (2004b), two observers analyzed microwear for 13 ungulate species (258 individuals) and found essentially homogenous pit and scratch average counts within each dietary category with essentially no observer differences. Townsend and Croft (2008) analyzed 13 ungulate species and compared these data to that of Solounias and Semprebon (2002) and were unable to reproduce the same average scratch values for grazers but found similar values for other dietary categories. It is difficult to understand the nature of the error in these studies. In addition to a lack of explicit observer blindness, each observer worked at different locations and could not possibly have been examining the identical area on each tooth or, in the case of Townsend and Croft (2008), the same specimens. Without explicit observer blindness, it is difficult to rule out the possibility that dental microwear analysis has become, in-part, a self-fulfilling prophecy where the microwear patterns that are sought out are manufactured to some degree.
CONCLUSION
Pattern recognition technology has improved significantly in recent years and automated confocal microscopy techniques that eliminate the human observer are increasingly adopted (Scott et al., 2006; Krueger et al., 2008; Merceron et al., 2010b; Ungar et al., 2010a). Despite this, the rate of SEM and LDM dental microwear research has also accelerated, and we believe there are still justifiable reasons to perform dental microwear analyses in the more traditional sense. LDM enables analysis of large samples of specimens, is low-cost, uses equipment that is available to almost every university and museum researcher, and describes microwear patterns (as pits and scratches) in a way that is conceptually relevant to the mechanics of food-tooth interaction. Regardless of methodology, a human observer will always be involved in the selection of specimens, selection of the area of the tooth examined, and in differentiating antemortem microwear from postmortem artifacts. Going forward, we believe that considerably more caution is needed in LDM analyses, however, future studies will be able to adopt methods that are improved upon, particularly in ways that minimize the potential for observer bias and other error factors. We believe that analysis of specimens directly under the microscope is fraught with considerable logistical difficulties that not only make it considerably difficult to evaluate error, but may also increase error.
Purnell et al. (2006) suggested if instrumentation and manipulation of images is standardized, it may be possible to reduce observer error to the point where it is no longer significant. However, it is not clear how much experience or training is needed to diminish observer error to statistical insignificance. Microwear features vary in contrast and clarity, from fresh isolated features that are unanimously interpreted in the same way, to features that are worn, faint in appearance, and overprinted by more recent microwear, where the borders of microwear features and even the interpretation of overlapping microwear features are ambiguous. We found evidence that error diminished with experience and that observer error rates for experienced observers was similar to interobserver rates found for experienced observers using SEM. However, we did not reach a point where observer error was always insignificant among any of the five observers. It also appears that the amount of experience and practice needed to eliminate significant error varies from person to person.
Although significant interobserver differences were less frequently found among experienced observers, all observers had a difficult time recovering statistically indistinguishable counts of microwear features, but with a minor amount of initial practice found it comparatively easy to achieve highly significant observer correlation. These results suggest that paleodietary predictions made for fossil taxa via statistical comparison to data from preexisting extant microwear databases (e.g., Solounias and Semprebon, 2002; Merceron, 2005b) are unreliable. More accurate paleodietary predictions will result if researchers quarantined their data from those of other observers during statistical tests, or even from their own data collected in earlier studies where the data are separated by time and experience. Rather than mixing data with those from pre-published databases composed of mean pit and scratch counts, researchers may be better served by building shared microwear image libraries for extant species.
ACKNOWLEDGMENTS
We thank I. Goudiaby, M. Ayoub, A. Homchaudhuri, and D. El-Neemany for assistance with molding and casting of microwear specimens. R. Hulbert (Florida Museum of Natural History) and E. Westwig (American Museum of Natural History) granted access to specimens. We thank NSF (grant EAR-0824657) for support to MCM. We thank N. Solounias for fruitful discussions leading up to this research.
REFERENCES
Beatty, B.L. 2007. Dental microwear as an indicator of substrate and suspended sediment interaction: Towards a finer view of marine mammal paleoecology. Journal of Vertebrate Paleontology, 27,Abstracts:45A.
Billet, G., Blondel, C., and de Muizon, C. 2009. Dental microwear analysis of notoungulates (Mammalia) from Salla (Late Oligocene, Bolivia) and discussion on their precocious hypsodonty. Palaeogeography, Palaeoclimatology, Palaeoecology, 274:114-124.
Boisserie, J.R., Zazzo, A., Merceron, G., Blondel, C., Vignaud, P., Likius A., Mackaye, H.T., and Brunet, M. 2005. Diets of modern and late Miocene hippopotamids: Evidence from carbon isotope composition and micro-wear of tooth enamel. Palaeogeography, Palaeoclimatology, Palaeoecology, 221:153-174.
Calandra, I., Göhlich, U.B., and Merceron, G. 2008. How could sympatric megaherbivores coexist? Example of niche partitioning within a proboscidean community from the Miocene of Europe. Naturwissenschaften, 95:831-838.
Calandra, I., Göhlich, U.B., and Merceron, G. 2010. Feeding preferences of Gomphotherium subtapiroideum (Proboscidea, Mammalia) from the Miocene of Sandelzhausen (Northern Alpine Foreland Basin, southern Germany) through life and geological time: evidence from dental microwear analysis. Palaeontologische Zeitschrift, 84:205-215.
DeMiguel, D., Fortelius, M., Azanza, B., and Morales, J. 2008. Ancestral feeding state of ruminants reconsidered: earliest grazing adaptation claims a mixed condition for Cervidae. BMC Evolutionary Biology, 8:13 (http://www.biomedcentral.com/1471-2148/8/13).
Domonko?ová Tibenská, K., Bodoriková,S., Katina, S., Kovácsová, V., Kubová, J., and Takács, M. 2010. Reconstruction of dietary habits on the basis of dental microwear and trace elements analysis of individuals from Gan cemetery (District Galanta, Slovakia). Anthropologischer Anzeiger, 68:67-84.
Firmat, C., Rodrigues, H.G., Hutterer, R., Rando, J.C., Alcover, J.A., and Michaux, J. 2011. Diet of the extinct Lava mouse Malpaisomys insularis from the Canary Islands: Insights from dental microwear. Naturwissenschaften, 98:33-37.
Franz-Odendaal, T.A. and Solounias, N. 2004. Comparative dietary evaluations of an extinct giraffid (Sivatherium hendeyi) (Mammalia, Giraffidae, Sivatheriinae) from Langebaanweg, South Africa (Early Pliocene). Geodiversitas, 26:675-685.
Galbany, J., Estebaranz, F., Martínez, L., and Pérez-Pérez, A. 2009. Buccal dental microwear variability in extant African Hominoidea: taxonomy versus ecology. Primates, 50:221-230.
Galbany, J., Estebaranz, F., Martínez, L.M., Romero, A., De Juan, J., Turbón, D., and Pérez-Pérez, A. 2006. Comparative analysis of dental enamel polyvinylsiloxane impression and polyurethane casting methods for SEM research. Microscopy Research and Technique, 69:246-252.
Galbany, J., Martínez, L.M., López-Amor, H.M., Espurz, V., Horaldo, O., Romero, A., de Juan, J., and Pérez-Pérez, A. 2005. Error rates in buccal-dental microwear quantification using scanning electron microscopy. Scanning, 27:23-29.
Goillot, C., Blondel, C., and Peigné, S. 2009. Relationships between dental microwear and diet in Carnivora (Mammalia)–Implications for the reconstruction of the diet of extinct taxa. Palaeogeography, Palaeoclimatology, Palaeoecology, 271:13-23.
Gordon, K.D. 1988. A review of methodology and quantification in dental microwear analysis. Scanning Microscopy, 2:1139-1147.
Goswami, A., Flynn, J.J., Ranivoharimanana, L., and Wyss, A.R. 2005. Dental microwear in Triassic amniotes: Implications for paleoecology and masticatory mechanics. Journal of Vertebrate Paleontology, 25:320-329.
Green, J.L. 2009. Dental microwear in the orthodentine of the Xenarthra (Mammalia) and its use in reconstructing the paleodiet of extinct taxa: the case study of Nothrotheriops shastensis (Xenarthra, Tardigrada, Nothrotheriidae). Zoological Journal of the Linnaean Society, 165:201-222.
Green, J.L., Semprebon, G.M., and Solounias, N. 2005. Reconstructing the palaeodiet of Florida Mammut americanum via low-magnification stereomicroscopy. Palaeogeography, Palaeoclimatology, Palaeoecology, 223:34-48.
Grine, F.E., Ungar, P.S., and Teaford, M.F. 2002. Error rates in dental microwear quantification using scanning electron microscopy. Scanning, 24:144-153.
Grine, F.E., Ungar, P.S., and Teaford, M.F. 2006. Was the early Pliocene hominin 'Australopithecus' anamensis a hard object feeder? South African Journal of Science, 102:301-310.
Grine, F.E., Judex, S., Daegling, D.J., Ozcivici, E., Ungar, P.S., Teaford, M.F., Sponheimer, M., Scott, J.R., Scott, R.S., and Walker, A. 2010. Craniofacial biomechanics and functional and dietary inferences in hominin paleontology. Journal of Human Evolution, 58:293-308.
Homchaudhuri, A., Mihlbachler, M.C., and Solounias. N. 2010. Dental microwear analysis of Eocene Brontotherioidea and implications for paleodietary interpretations of long extinct species. Journal of Vertebrate Paleontology, 29, Abstracts: 107A.
Joomun, S.C., Hooker, J.J., and Collinson, M.E. 2008. Dental wear variation and implications for diet: An example for Eocene perissodactyls (Mammalia). Palaeogeography, Palaeoclimatology, Palaeoecology, 263:92-106.
King, T., Andrews, P., and Boz, B. 1999. Effect of taphonomic processes on dental microwear. American Journal of Physical Anthropology, 108:359-373.
Koufos, G. D., Kostopoulos, D.S., and Merceron, G. 2009. The late Miocene mammal faunas of the Mytilinii Basin, Samos Island, Greece: New Collection: 17. Palaeoecology - Palaeobiogeography. Beitrage zur Paläontologie, 31:409-430.
Krueger, K.L., Scott, J.R., Kay, R.F., and Ungar, P.S. 2008. Technical note: Dental microwear textures of "Phase I" and "Phase II" facets. American Journal of Physical Anthropology, 137:485-490.
MacFadden, B.J., Solounias, N., and Cerling, T.E. 1999. Ancient diets, ecology, and extinction of 5-million-year-old horses from Florida. Science, 283:824-827.
Mainland, I.L. 2006. Pastures lost? A dental microwear study of ovicaprine diet and management in Norse Greenland. Journal of Archaeological Science, 33:238-252.
Merceron, G., de Bonis, L., Viriot, L., and Blondel, C. 2005a. Dental microwear of fossil bovids from northern Greece: paleoenvironmental conditions in the eastern Mediterranean during the Messinian. Palaeogeography, Palaeoclimatology, Palaeoecology, 217:173-185.
Merceron, G., Escarguel, G., Angibault, J.-M., and Verheyden-Tixier, H. 2010a. Can dental microwear textures record inter-individual dietary variations? PLoS ONE, 5:e9542.
Merceron, G., Kaiser, T., Kostopoulos, D.S., and Schultz, E. 2010b. Ruminant diets and the Miocene extinction of European great apes. Proceedings of the Royal Society B, 277:3105-3112.
Merceron, G., Blondel, C., de Bonis, L., Koufos, G.D., and Viriot, L. 2005b. A new method of dental microwear analysis: Application to extant primates and Ouranopithecus macedoniensis (Late Miocene of Greece). Palaios, 20:551-561.
Merceron, G., Blondel, C., Brunet, M., Sen, S., Solounias, N., Viriot, L., and Heintz, E. 2004. The Late Miocene paleoenvironment of Afghanistan as inferred from dental microwear in artiodactyls. Palaeogeography, Palaeoclimatology, Palaeoecology, 207:143-163.
Mihlbachler, M.C. and Beatty, B.L. 2011. Effects of variable magnification and imaging resolution on paleodietary interpretations derived from dental microwear analysis. Journal of Vertebrate Paleontology 30 (Abstracts): 157.
Nelson, S.V., Badgley, C., and Zakem E. 2005. Microwear in modern squirrels in relation to diet. Palaeontologia Electronica, 8; 14A:1-15.
?si, A. and Weishampel, D.B. 2009. Jaw mechanism and dental function in the late cretaceous basal eusuchian Iharkutosuchus. Journal of Morphology, 270:903-920.
Peigné, S., Goillot, C., Germonpré, M., Blondel, C., Bignon, O., and Merceron, G. 2009. Predomancy omnivory in European cave bears evidenced by a dental microwear analysis of Ursus spelaeus from Goyet, Belgium. Proceedings of the Academy of Natural Sciences, 106:15390-15393.
Purnell, M.A. 1995. Microwear on conodont elements and macrophagy in the first vertebrates. Nature, 374:798-800.
Purnell, M.A., Hart P.J.B., Baines, D.C., and Bell, M.A. 2006. Quantitative analysis of dental microwear in threespine stickleback: a new approach to analysis of trophic ecology in aquatic vertebrates. Journal of Animal Ecology, 75:967-977.
Ramdarshan, A., Merceron, G., Tafforeau, P., and Marivaux. L. 2010. Dietary reconstruction of the Amphipithecidae (Primates, Anthropoidea) from the Paleogene of South Asia and paleoecological implications. Journal of Human Evolution, 59(1):96-108.
Rivals, F. and Deniaux, B. 2003. Dental microwear analysis for investigating the diet of an argali populations (Ovis ammon antiqua) of mid-Pleistocene age, Caune de l'Argo cave, eastern Pyrenees, France. Palaeogeography, Palaeoclimatology, Palaeoecology, 193:443-455.
Rivals, F. and Solounias, N. 2007. Differences in tooth microwear of populations of caribou (Rangifer tarandus, Ruminantia, Mammalia) and implications to ecology, migration, glaciations and dental evolution. Journal of Mammalian Evolution, 14:182-192.
Rivals, F., Schulz, E., and Kaiser, T. 2008. Climate-related dietary diversity of the ungulate faunas from the middle Pleistocene succession (OIS 14-12) at the Caune de l'Argo (France). Paleobiology, 34(1):117-127.
Rivals, F., Solounias, N., and Mihlbachler, M.C. 2007. Evidence for geographic variation in the diets of late Pleistocene and early Holocene Bison in North America, and differences from the diets of recent Bison. Quaternary Research, 68:338-346.
Rivals, F., Solounias, N., and Schaller, G.B. 2011. Diet of Mongolian gazelles and Tibetan antelopes from steppe habitats using premaxillary shape, tooth mesowear and microwear analysis. Mammalian Biology, 76(3):358-364.
Rivals, F., Mihlbachler, M.C., Solounias, N., Mol, D., Semprebon, G.M., and de Vos, J. 2010. Palaeoecology of the mammoth steppe fauna from the late Pleistocene of the North Sea and Alaska: separative species preference from geographic influence in palaeoecological dental wear analysis. Palaeogeography, Palaeoclimatology, Palaeoecology, 286:42-54.
Rodrigues, H.G., Merceron, G., and Viriot, L. 2009. Dental microwear patterns of extant and extinct Muridae (Rodentia, Mammalia): ecological implications. Naturwissenschaften, 96:537-542.
Schultz, E., Fahlke, J.M., Merceron, G., and Kaiser, T. 2007. Feeding ecology of the Chalicotheriidae (Mammalia, Perissodactyla, Ancylopoda). Results from dental micro- and mesowear analyses. Verhandlungen des Naturwissenschaftlichen Vereins zu Hamburg, 43:5-31.
Scott, R., Schubert, B., Grine, F.E., and Teaford, M.F. 2008. Low magnification microwear: Questions of precision and repeatability. Journal of Vertebrate Paleontology, 28(Supplement to No. 3):139A.
Scott, R.S., Ungar, P.S., Bergstrom, T.S., Brown, C.A., Childs, B.E., Teaford, M.F., and A. Walker. 2006. Dental microwear texture analysis: technical considerations. Journal of Human Evolution. 51:339-349.
Semprebon, G.M. and Rivals F. 2007. Was grass more prevalent in the pronghorn past? An assessment of the dietary adaptations of Miocene to recent Antilocapridae (Mammalia: Artiodactyla). Palaeogeography, Palaeoclimatology, Palaeoecology, 253:332-3347.
Semprebon, G.M. and Rivals, F. 2010. Trends in the paleodietary habits of fossil camels from the Tertiary and Quaternary of North America. Palaeogeography, Palaeoclimatology, Palaeoecology, 295:131-145.
Semprebon, G., Janis, C.M., and Solounias N. 2004a. The diets of the Dromomerycidae (Mammalia: Artiodactyla) and their response to Miocene vegetational change. Journal of Vertebrate Paleontology. 24:427-444.
Semprebon, G.M., Sise, P.J., and Coombs, M.C. 2011. Potential bark and fruit browsing as revealed by stereomicrowear analysis of the peculiar clawed herbivores known as chalicotheres (Perissodactyla, Chalicotherioidea). Journal of Mammalian Evolution, 18:33-55.
Semprebon, G., Godfrey, L., Solounias, N., Sutherland, M.R., and Jungers, W.L. 2004b. Can low-magnification stereomicroscopy reveal diet? Journal of Human Evolution, 47:115-144.
Solounias, N. and Semprebon, G. 2002. Advances in reconstruction of ungulate ecomorphology with applications to early fossil equids. American Museum Novitates, 3366:1-49.
Solounias, N., Rivals, F., and Semprebon, G.M. 2010. Dietary interpretation and paleoecology of herbivores from Pikermi and Samos (late Miocene of Greece). Paleobiology, 36:113-136.
Solounias, N., Teaford, M., and Walker, A. 1988. Interpreting the diet of extinct ruminants: the case of a non-browsing giraffid. Paleobiology, 14:287-300.
Townsend, K. E. and Croft, D.A. 2008. Diets of notoungulates from the Santa Cruz Formation, Argentine: New evidence from enamel microwear. Journal of Vertebrate Paleontology, 28:217-230.
Ungar, P.S., Grine, F.E., Teaford, M.F., and El Zaatari, S. 2006. Dental microwear and diets of African early Homo. Journal of Human Evolution, 50:78-95.
Ungar, P.S., Scott, R.S., Grine, F.E., and Teaford, M.F. 2010a. Molar microwear textures and the diets of Australopithecus anamensis and Australopithecus afarensis. Philosophical Transactions of the Royal Society of London B, 365:3345-3354.
Ungar, P.S., Scott, J.R., Schubert, B.W., and Stynder, D.D. 2010b. Carnivoran dental microwear textures: comparability of carnassial facets and functional differentiation of postcanine teeth. Mammalia, 74:219-224.
Ungar, P.S., Teaford, M.F., Glander, K.E., and Pastor, R.F. 1995. Dust accumulation in the canopy: A potential cause of dental microwear in primates. American Journal of Physical Anthropology, 97:93-99.
Walker, A., Hoeck, H.N., and Perez, L. 1978. Microwear of mammalian teeth as an indicator of diet. Science, 201:908-910.
Webb, S.D. and Simons, E. 2006. Vertebrate Paleontology, p. 215-246 in Webb, S.D. (ed.), First Floridians and Last Mastodons: the Page-Ladson Site in the Aucilla River. Springer Verlag, Dordrecht.
Whitlock, J.A. 2011. Inferences of diplodocoid (Sauropoda: Dinosauria) feeding behavior from snout shape and microwear analyses. PLoS ONE, 6(4):e18304.
Williams, F.L. and Patterson, J.W. 2010. Reconstruction the paleoecology of Taung, South Africa from low magnification of dental microwear features in fossil primates. Palaios, 25:439-448.
Williams, V.S. and Doyle, A.M. 2010. Cleaning fossil tooth surfaces for microwear analysis: Use of solvent gels to remove resistant consolidant. Palaeontologia Electronica, 13:2T:12p.
