FIGURE 1. Resolution was iteratively degraded in two ways. The grid represents pixel density, the physical size of the image represents magnification. The top image represents the maximum pixel density and maximum magnification. In the lower left, the same wear surface is sampled at the same magnification but with a lower pixel density. In the lower right, the same wear surface is viewed with a lower magnification, also resulting in an equivalent decrease in pixel density with respect to the tooth surface.
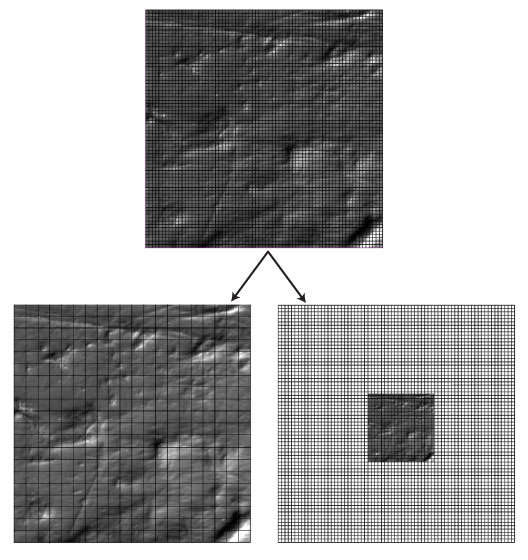
FIGURE 2. Resulting resolutions from iteratively reduced pixel density (left column) and reduced magnification (right column). These images are best viewed while zooming in on a computer display.
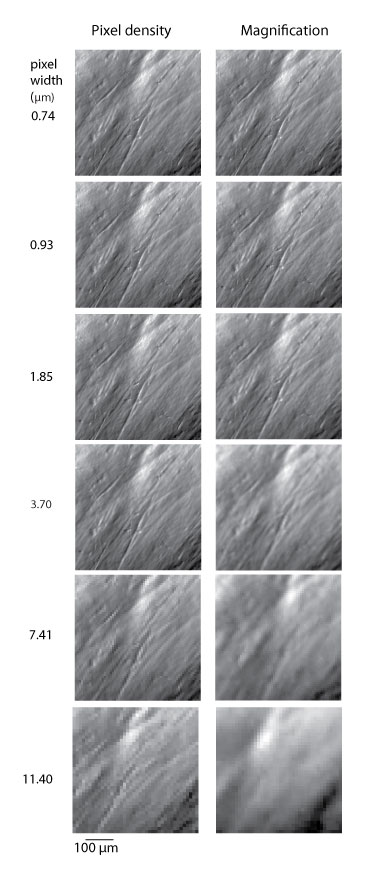
FIGURE 3. A single microwear image iteratively degraded by reducing pixel density (center column), showing microwear interpretations (left column) and an enlarged close-up (right column).
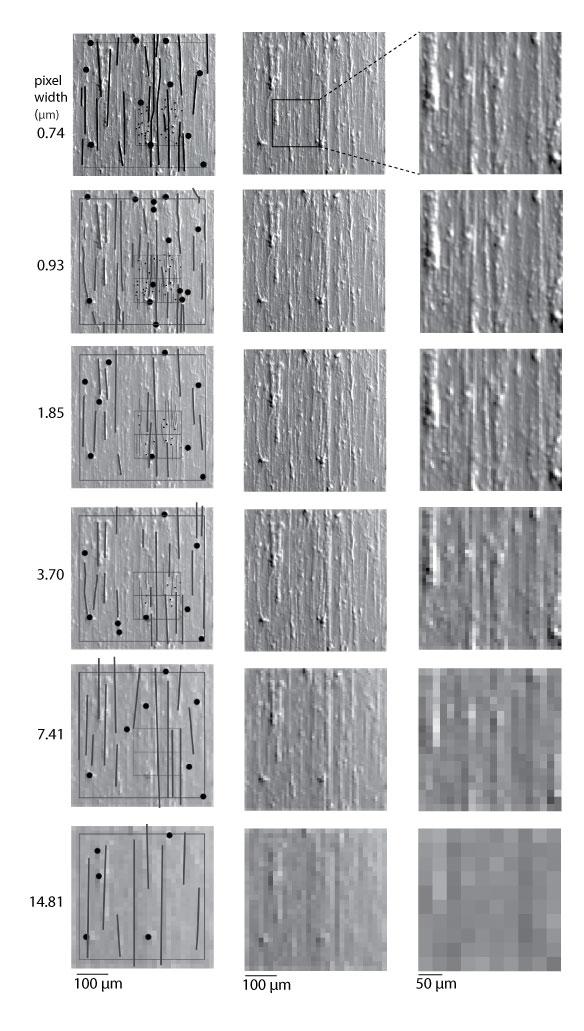
FIGURE 4. The microscope and camera used in this study, demonstrating calculations of optical magnification and digital resolution.
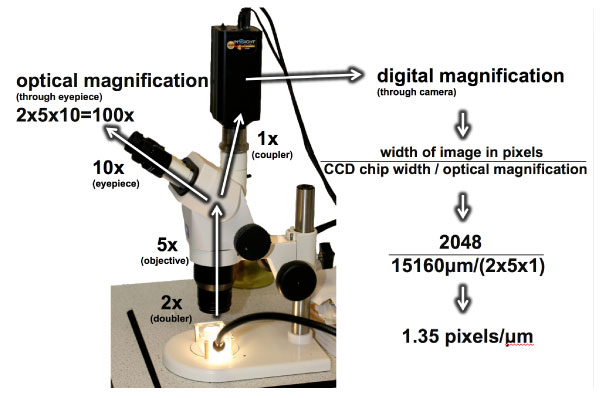
FIGURE 5. Interobserver Pearson correlation coefficients (PCC) for microwear features from 30 identical images repeatedly analyzed at different pixel densities with constant magnification.
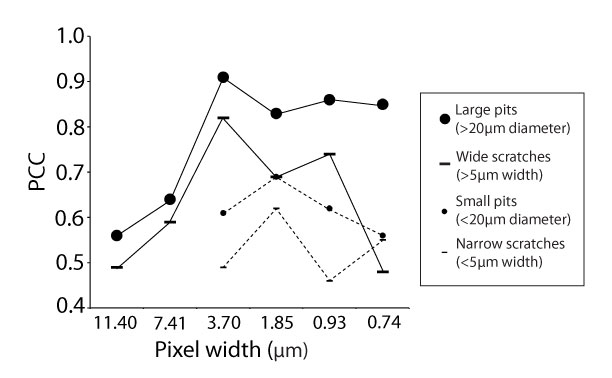
FIGURE 6. Means and standard errors of microwear features for two observers who independently analyzed 30 images (10 per species) with different pixel densities.
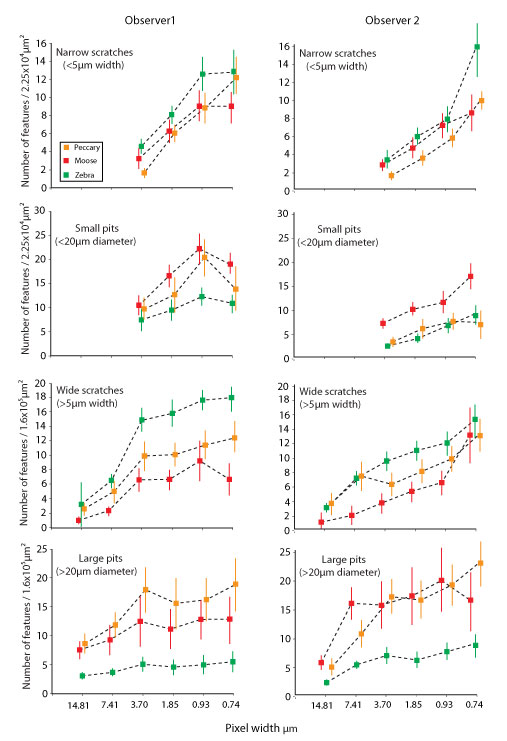
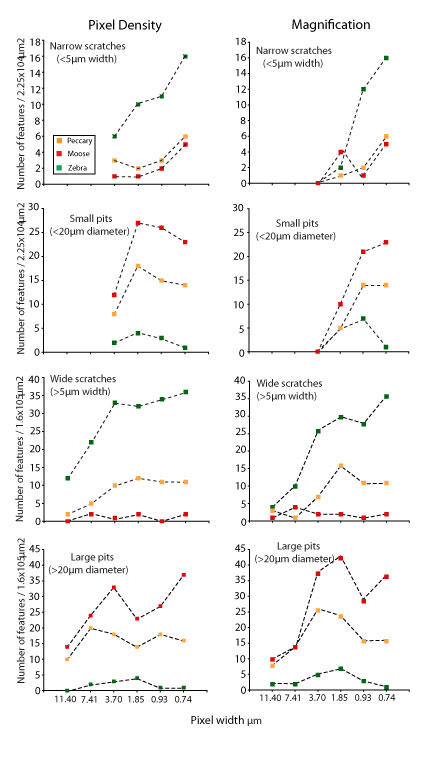
FIGURE 7. Comparison of microwear data from a single observer collected from three specimens with iterative decreases in pixel density (left column) and magnification (right column).