FIGURE 1. Location map and stratigraphic section showing the geographic and stratigraphic distribution of Revueltosaurus and Krzyzanowskisaurus. This includes the localites of the Revueltosaurus (NMMNH locality 1) and Krzyzanowskisaurus (UCMP locality 7307) teeth described here. Tooth illustrations after Heckert (2002, 2005). LVF = land vertebrate faunachron (following Lucas et al., 2007); L-1171 = type location of Krzyzanowskisaurus hunti; PFV = locality yielding abundant Revueltosaurus fossils in the Petrified Forest National Park.
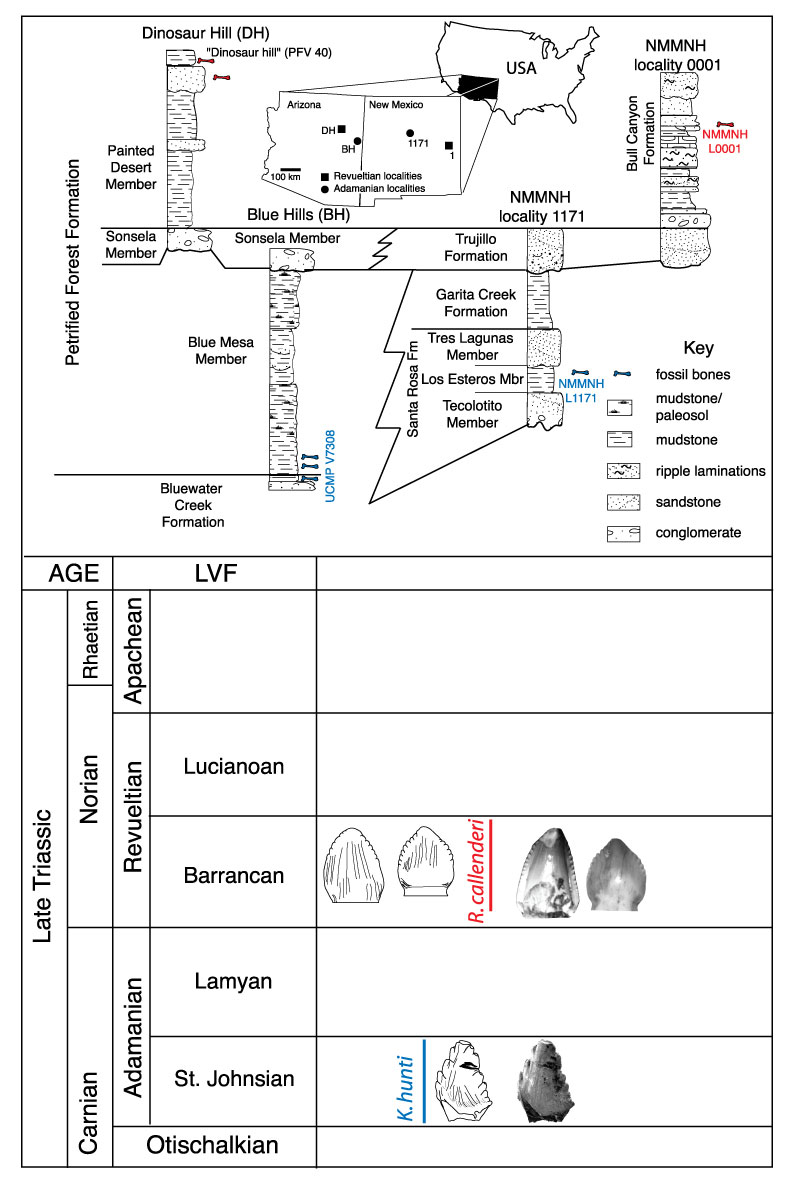
FIGURE 2. Generalized archosaurian phylogeny showing the relationships of taxa sampled by Sander (1999) and Hwang (2005) (in black) as well as Revueltosaurus (red) and Krzyzanowskisaurus (blue). Dashed lines demonstrate the two hypothesized positions of Krzyzanowskisaurus, either as a crurotarsan closely allied to Revueltosaurus (e.g., Parker et al., 2005; Irmis et al., 2007) or a basal ornithischian (Heckert, 2002, 2005).
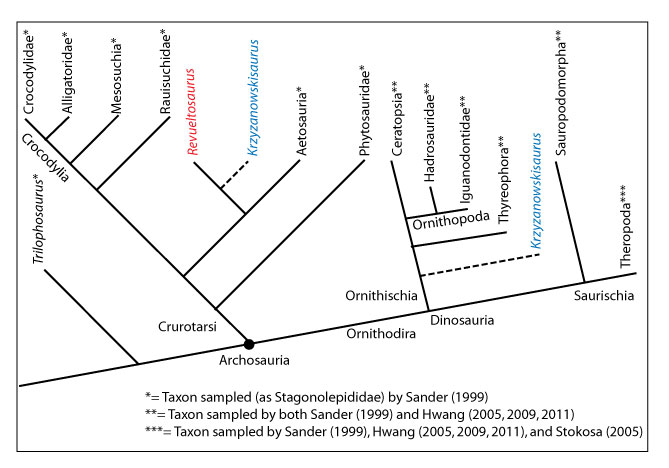
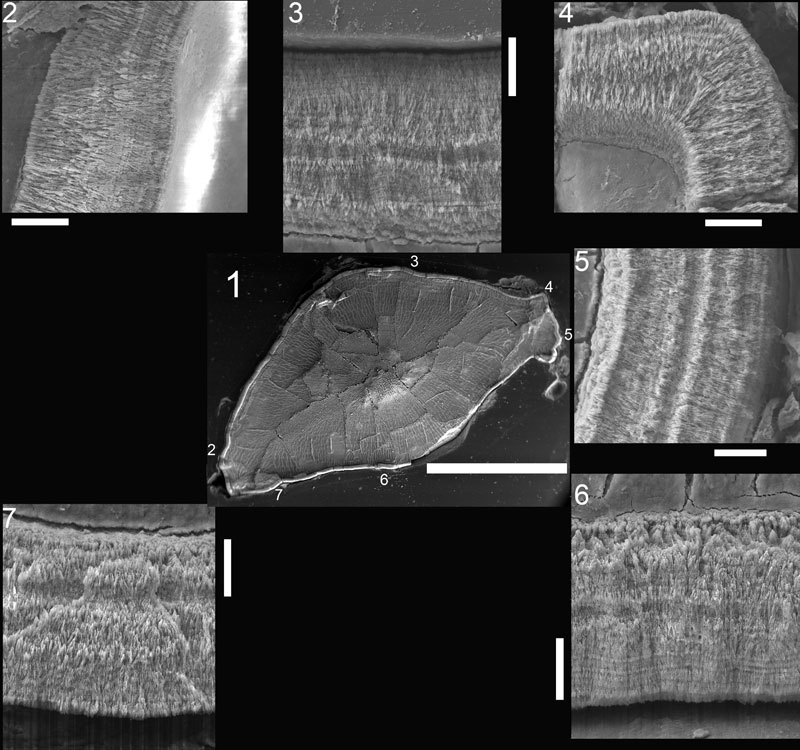
FIGURE 3. Variation in enamel thickness in the teeth of Revueltosaurus callenderi. 1-9, premaxillary tooth (P-33799); 10-14, maxillary tooth (P-33798). 1, overview of premaxillary tooth indicating approximate place where measurements and micrographs shown in this figure and Figure 4 were taken; 2-9, close-up views showing enamel thickness variation, with enamel-dentine junction (EDJ) oriented relative to overview in (1); and 10, overview of maxillary tooth section, indicating approximate place where measurements and micrographs shown in this figure and Figure 5 were taken; 11-14, close-up views showing enamel thickness variation, with enamel-dentine junction (EDJ) oriented relative to overview in (10). Scale bars equal 100 µm except for 1 (5 mm), 2 (10 µm), and 10 (2 mm). Click to see image close-ups.
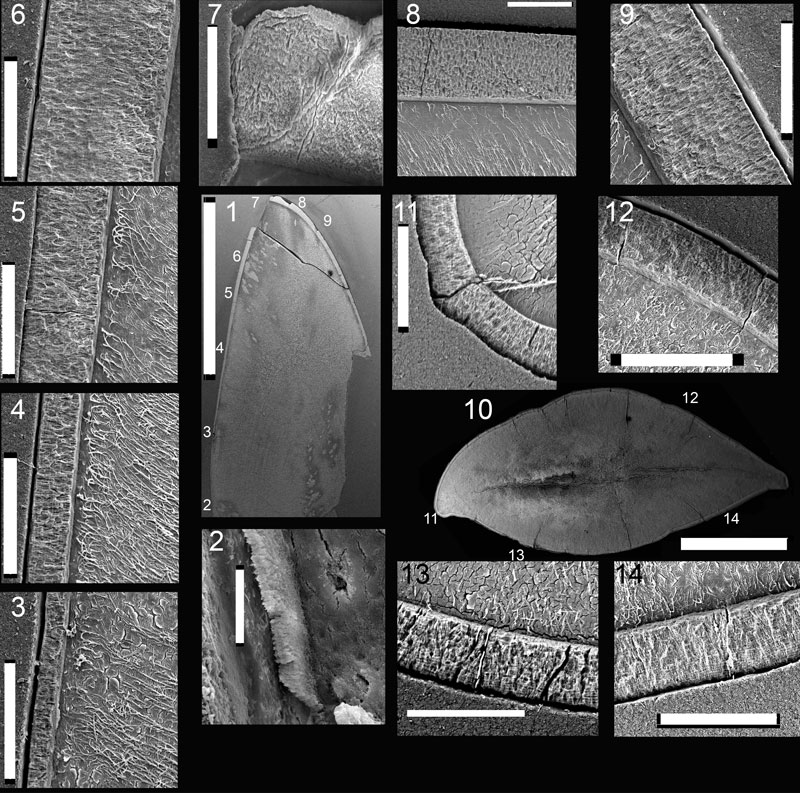
FIGURE 4. Scanning electron microscope images of NMMNH P-33799, Revueltosaurus callenderi premaxillary tooth showing variation in enamel microstructure in longitudinal section. 1, overview of tooth indicating approximate place where measurements and micrographs shown in this figure were taken; 2-8, close-up views showing enamel thickness variation, with enamel-dentine junction (EDJ) to the left and the outer enamel surface (OES) to the right. White scale bars = 20 µm except for 1 (5 mm) and 4 (50 µm). Click to see image close-ups.
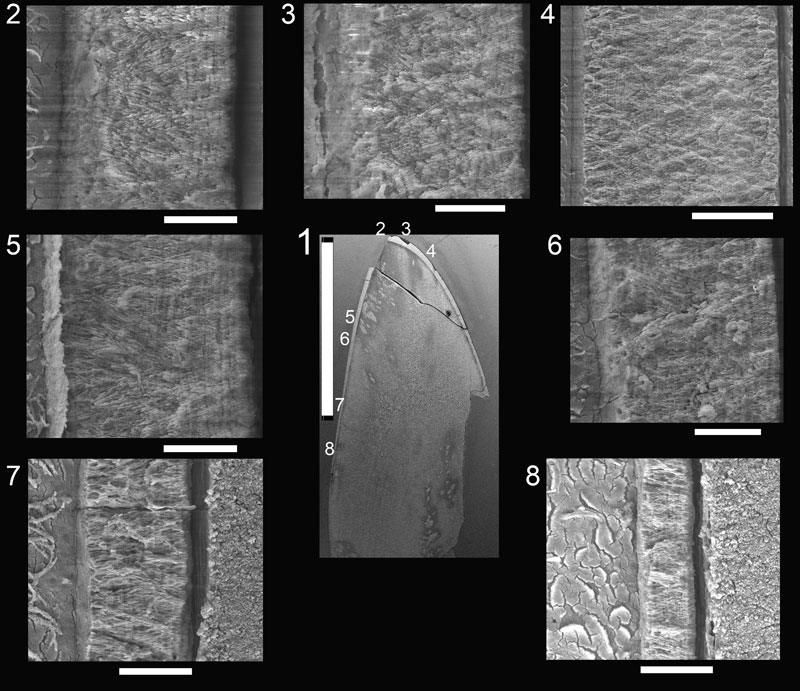
FIGURE 5. Scanning electron microscope images of NMMNH P-33798, Revueltosaurus callenderi maxillary tooth enamel microstructure in transverse section. 1, overview of tooth indicating approximate place where measurements and micrographs shown in this figure were taken; 2-8, close-up views showing enamel thickness variation, with EDJ oriented relative to overview in (1) and OES away from the same overview. Scale bars equal 20 µm except 1 (2 mm), 3 (50 µm). Click to see image close-ups.
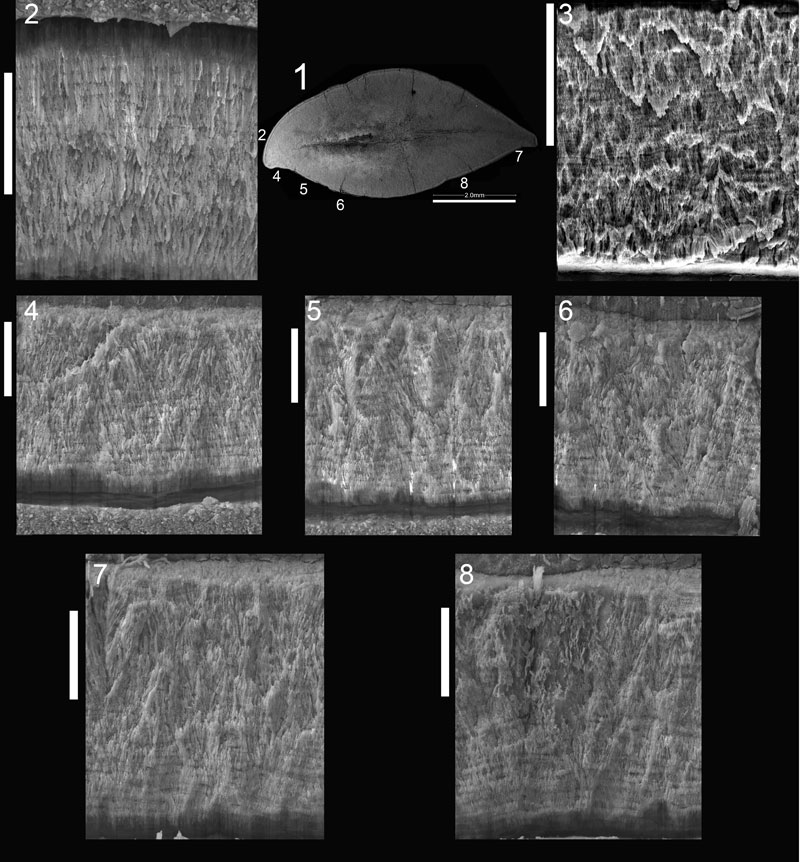
FIGURE 6. Scanning electron microscope images of UCMP 165213, Krzyzanowskisaurus hunti tooth enamel microstructure in longitudinal section. 1, overview of tooth indicating approximate place where measurements and micrographs shown in this figure were taken; 2-4, close-up views showing enamel thickness variation, with EDJ oriented relative to overview in (1) and OES away from the same overview. Scale bars equal 2 mm (1), 50 µm (2-3), and 100 µm (4). Click to see image close-ups.
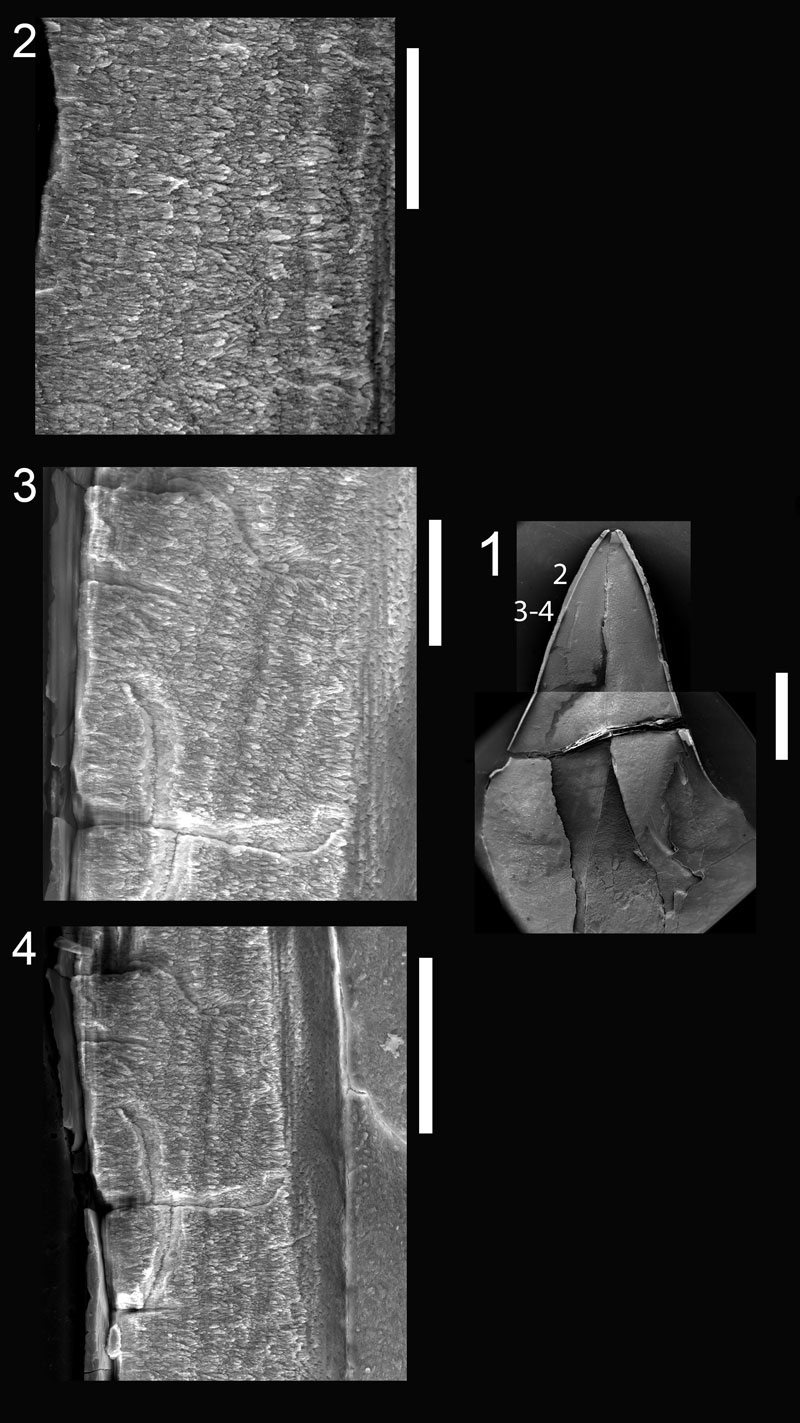
FIGURE 7. Scanning electron microscope images of UCMP 165211, Krzyzanowskisaurus hunti premaxillary tooth enamel microstructure in transverse section. 1, overview of tooth indicating approximate place where measurements and micrographs shown in this figure were taken; 2-7, close-up views showing enamel thickness variation, with EDJ oriented relative to overview in (1) and OES away from the same overview. Scale bar equals 20 µm except 1 (2 mm). Click to see image close-ups.