FIGURE 1. Location map showing the sampling site situated on the northern coast of the Beagle Channel. 1. The maps on the left side show the position of the studied area in southern South America. 2. The aerial photography (1:20.000) shows the area affected by the Holocene marine transgression. Radiocarbon dates were previously performed for Sites 1 and 2. Trophon geversianus shells with drillholes were recovered from the left part in Site 1.
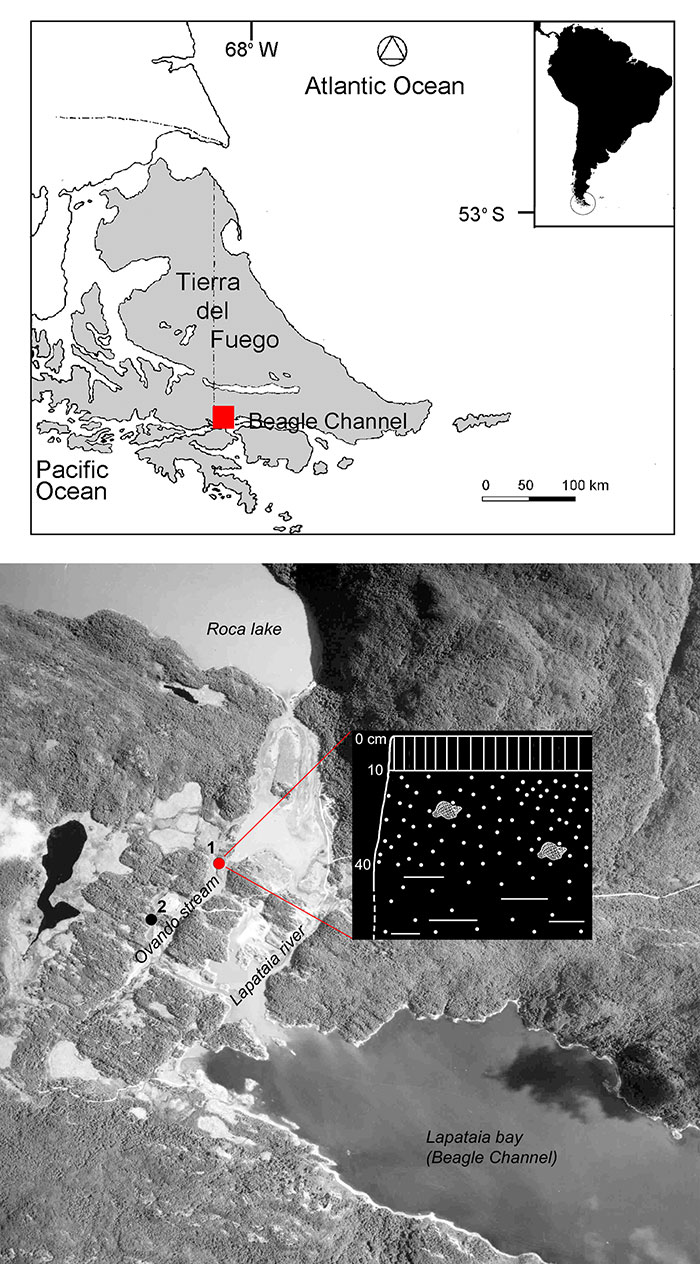
FIGURE 2. Landscape evolution of the studied area during the Holocene. 1. Glacilacustrine conditions after deglaciation during the early Holocene. 2. Sea transgression/regression during the middle Holocene. 3. The landscape during the late Holocene. 4. Animated landscape evolution (using Blender 2.64) (click on image to run animation).
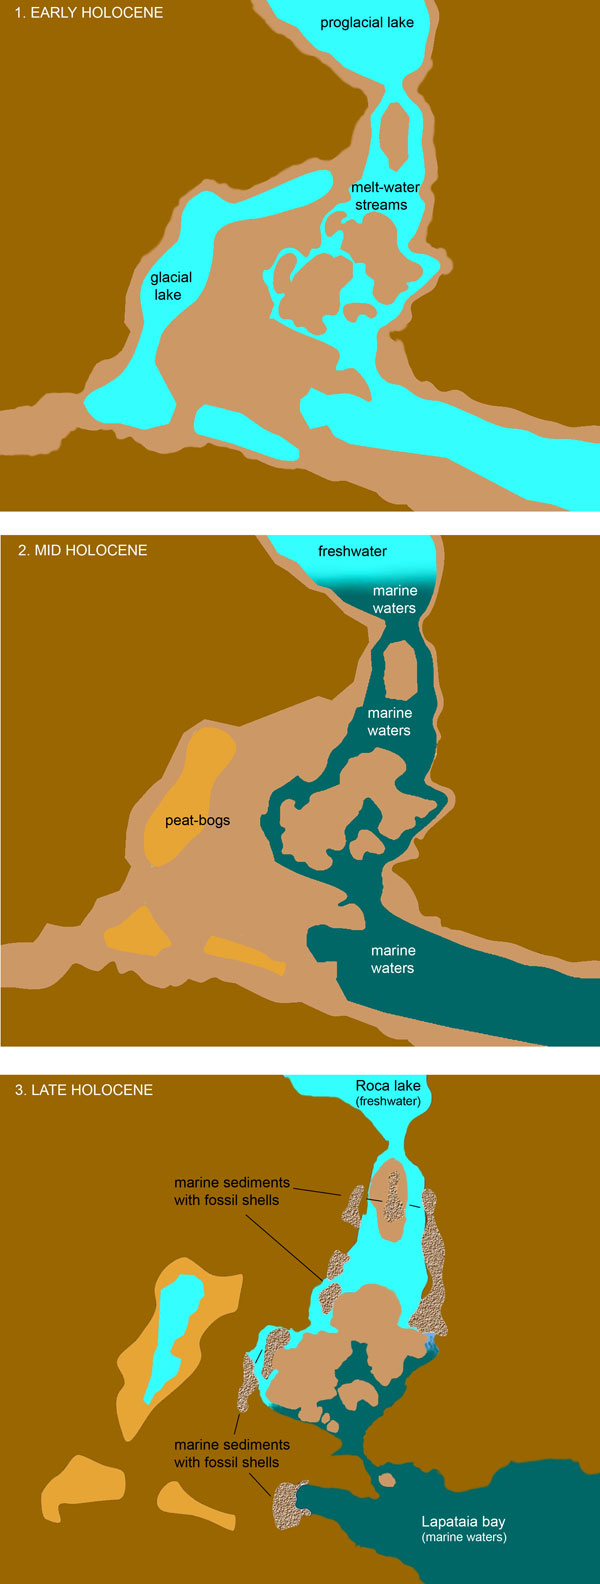
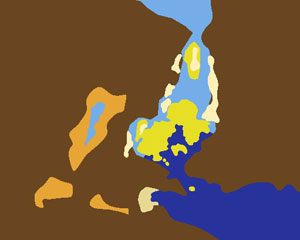
FIGURE 3. Holocene Trophon geversianus shells with drillholes attributed to conspecifics from the Cormoranes Archipelago (Beagle Channel). 1. CEGH-UNC 25410. 2. CEGH-UNC 25411. 3-4. CEGH-UNC 25412. 5. CEGH-UNC 25413. 6. CEGH-UNC 25414. 7. CEGH-UNC 25415. 8. CEGH-UNC 25416. Scales= 1 cm.
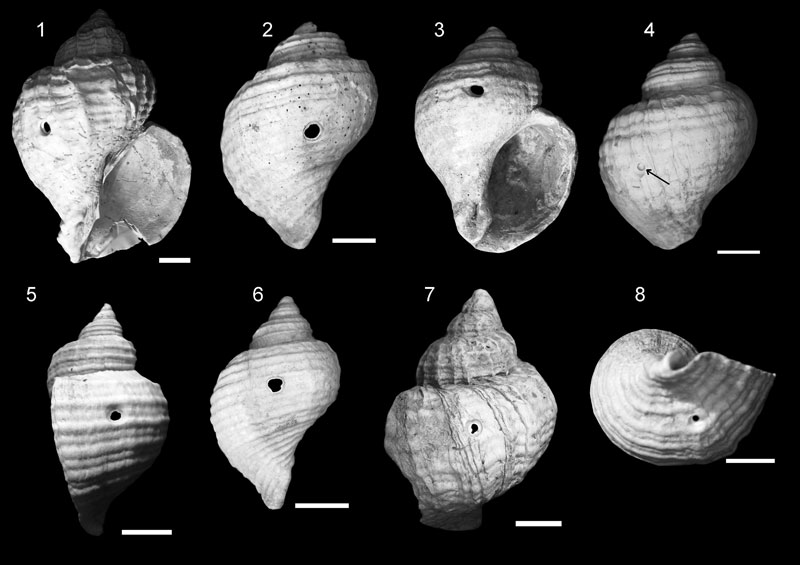
FIGURE 4. A Trophon geversianus specimen (See also Figure 3.1.) in 3D created using photoshop. The form of the drillhole is easier to interpret in 3D. This photograph was made using anaglyph techniques, which combine two photographs one in red and the other in cyan (blue+green) color. Three-dimensional red-cyan glasses are recommended to view this image correctly.
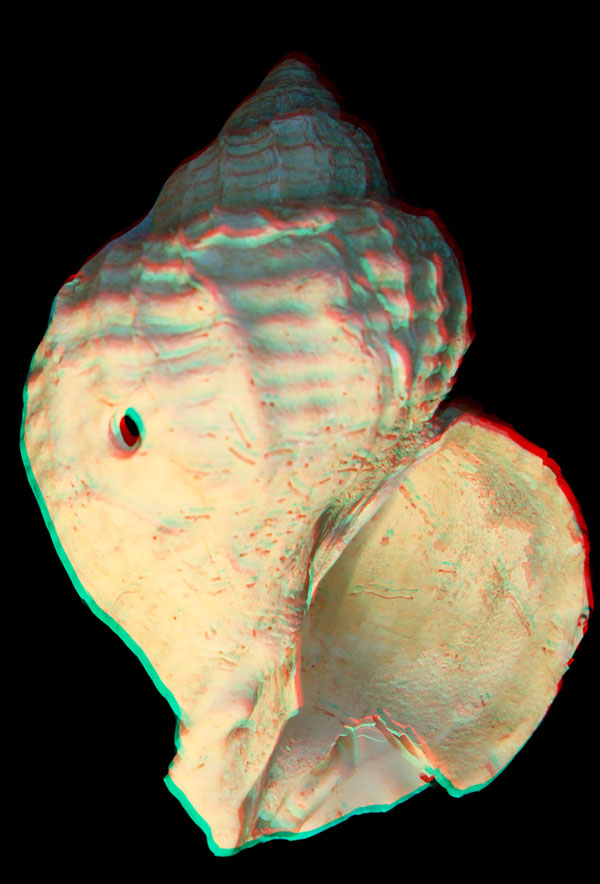
FIGURE 5. Drilled and non-drilled Trophon geversianus shells in three size classes. Size classes (shell width): I, 20.00-29.99 mm; II, 30.00-39.99 mm; III, 40.00-49.99 mm.
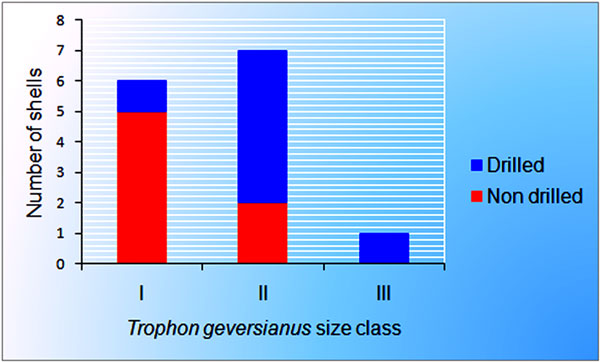
FIGURE 6. Larger and smaller predators with respect to their prey.
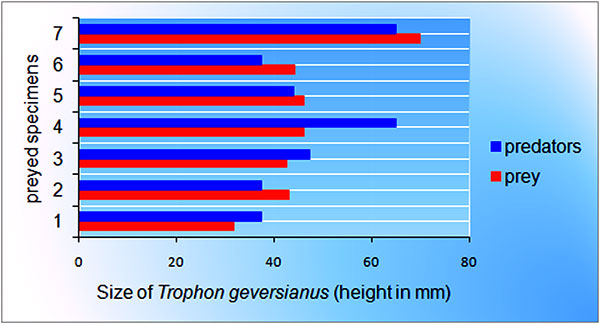
FIGURE 7. The relationship between predation time in days and borehole depth (thickness of the shell); r=0.88683; p (uncorr)= 0.0014349
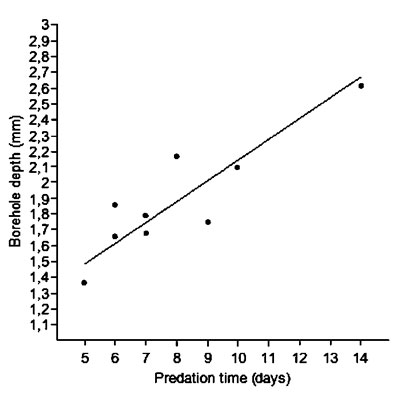
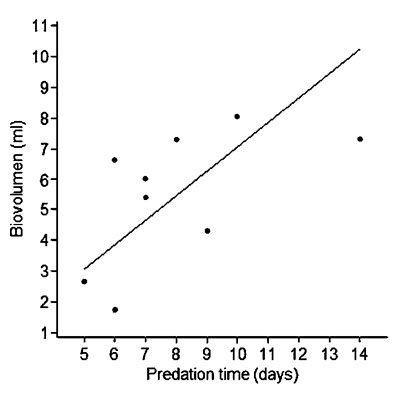
FIGURE 8. The relationship between predation time in days and biovolume as an indicator of biomass. r=0.58915; p (uncorr)= 0.095.