FIGURE 1.Bulungu muirheadae, sp. nov. Holotype QM F10666, 1, occlusal view of left dentary; 2, buccal view of left dentary. Paratype QM F10668, 3, occlusal view of left dentary; 4, buccal view of left dentary. Paratype QM F10669, 5, buccal view of right dentary; 6, lingual view of right dentary. Scale bars for 1-4 equals 1mm, for 5-6 equals 2mm.
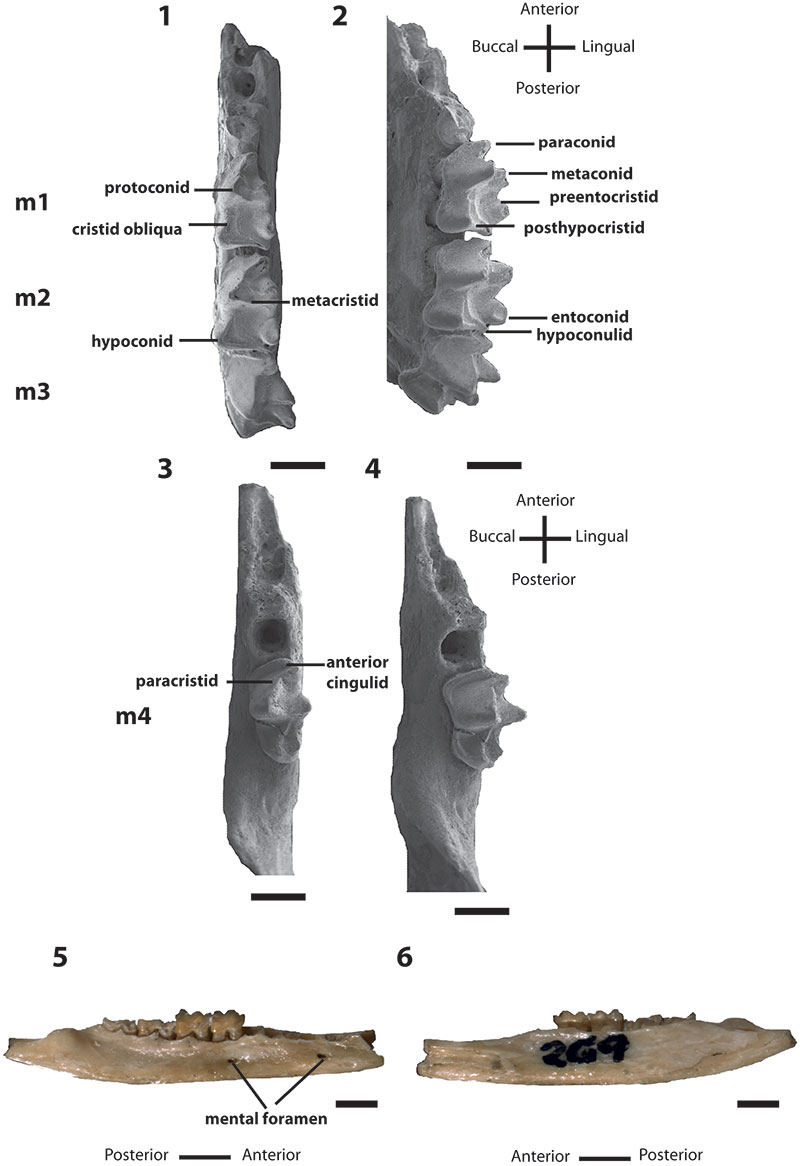
FIGURE 2.Bulungu muirheadae, sp. nov. Paratype UCR 15207, 1, occlusal view stereo pair of M1. Paratype QM F10664, 2, occlusal view stereo pair of M2. Paratype UCR 15275, 3, occlusal view stereo pair of M3. Scale bar equals 1mm.
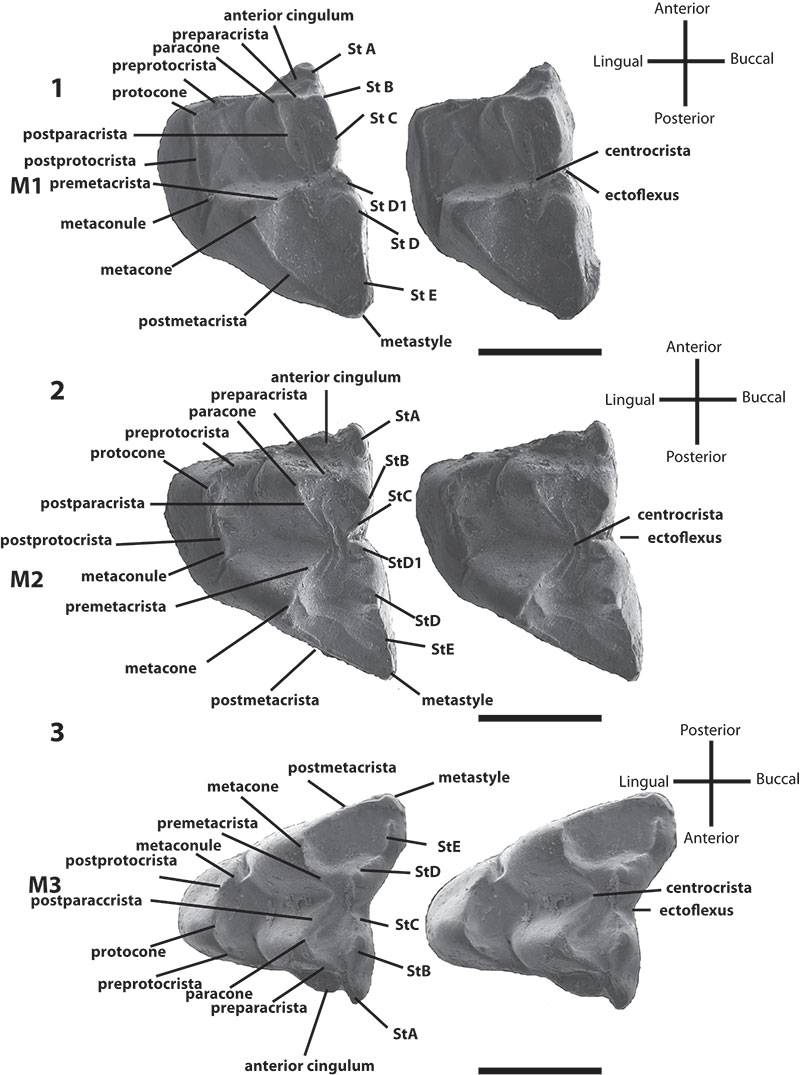
FIGURE 3.Bulungu campbelli, sp. nov. Holotype SAM P13853, 1, lingual view of m1; 2, occlusal view of m1; 3, buccal view of m1; 4, buccal view of right dentary; 5, buccal/occlusal view of right dentary; 6, occlusal view of right dentary; 7, stereo pair of occlusal view of right maxilla. Scale bar equals 1mm.
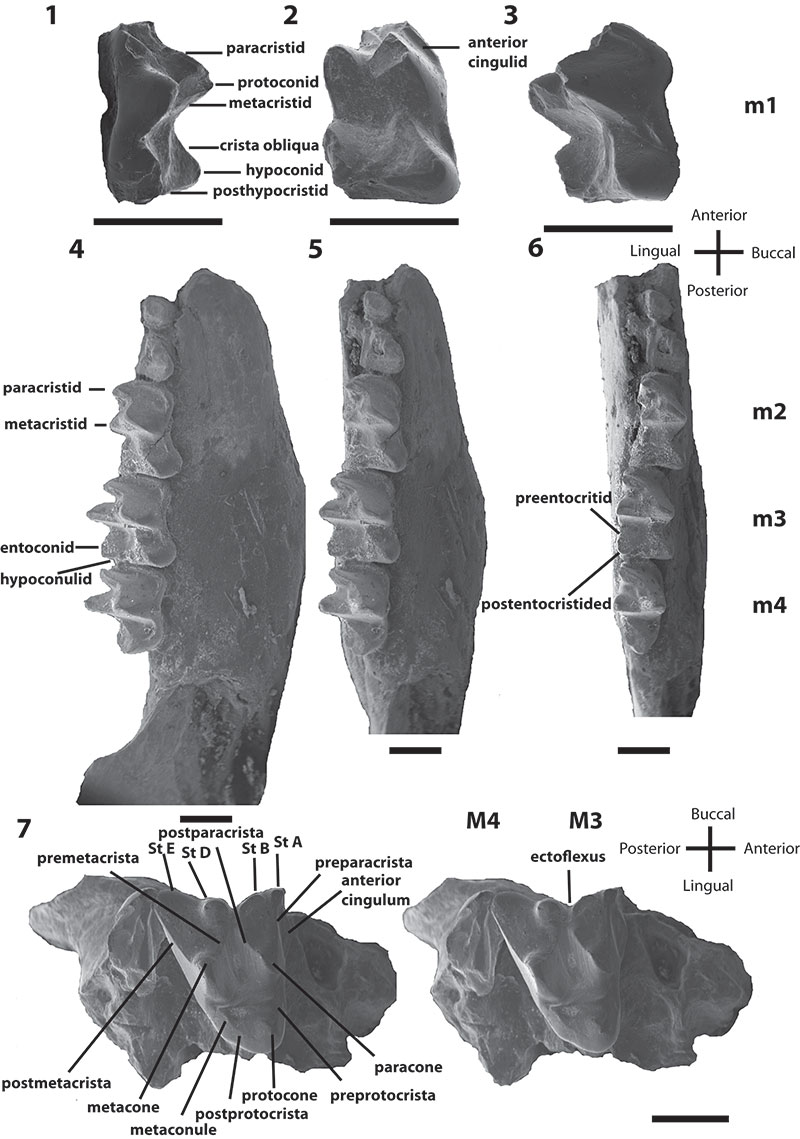
FIGURE 4. Phylogenetic relationships of Bulungu muirheadae and B. campbelli sp. nov. based on our 156 character craniodental matrix. Fossil and recently extinct taxa are indicated by †. Bulungu muirheadae and B. campbelli are highlighted in bold. Crown-group Peramelemorphia is bracketed. 1, strict consensus of 8 most parsimonious trees (tree length = 889; consistency index excluding uninformative characters = 0.3412; retention index = 0.6560) from unconstrained maximum parsimony analysis of the matrix. Numbers above branches represent bootstrap values (1000 replicates); numbers below branches represent decay indices. 2, strict consensus of 24 most parsimonious trees (tree length = 917; consistency index excluding uninformative characters = 0.3308; retention index 0.6395) that result when the matrix is analysed using maximum parsimony and enforcing a "backbone" molecular scaffold based on Westerman et al. (2012).
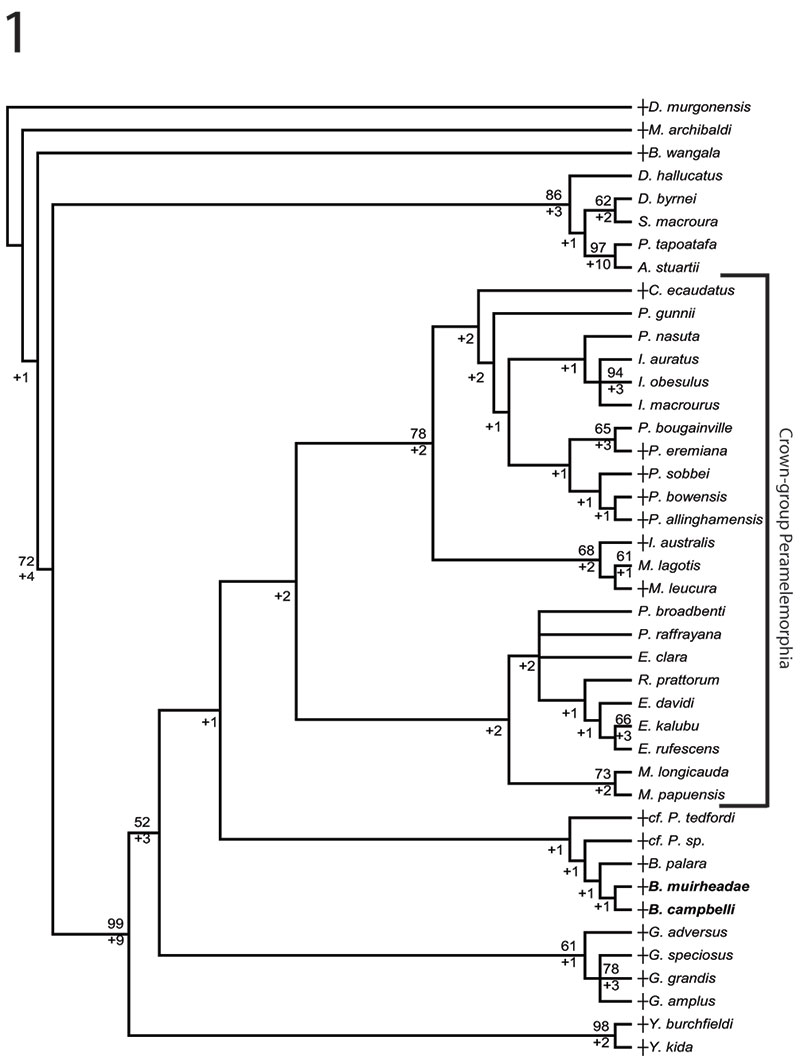
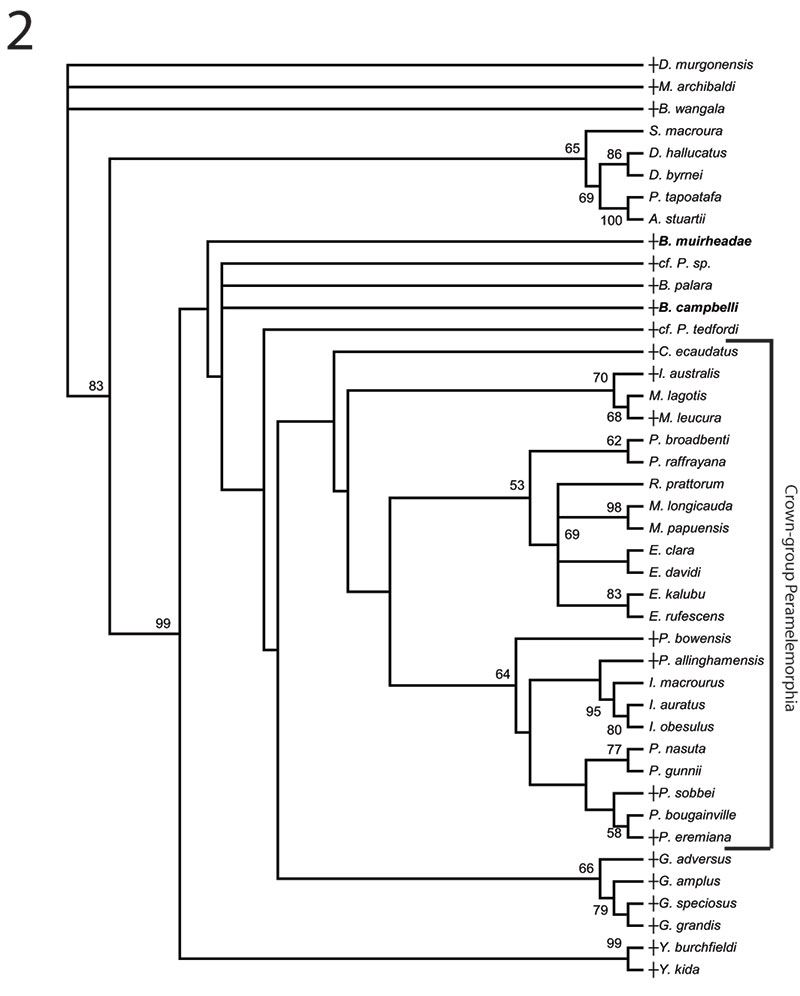
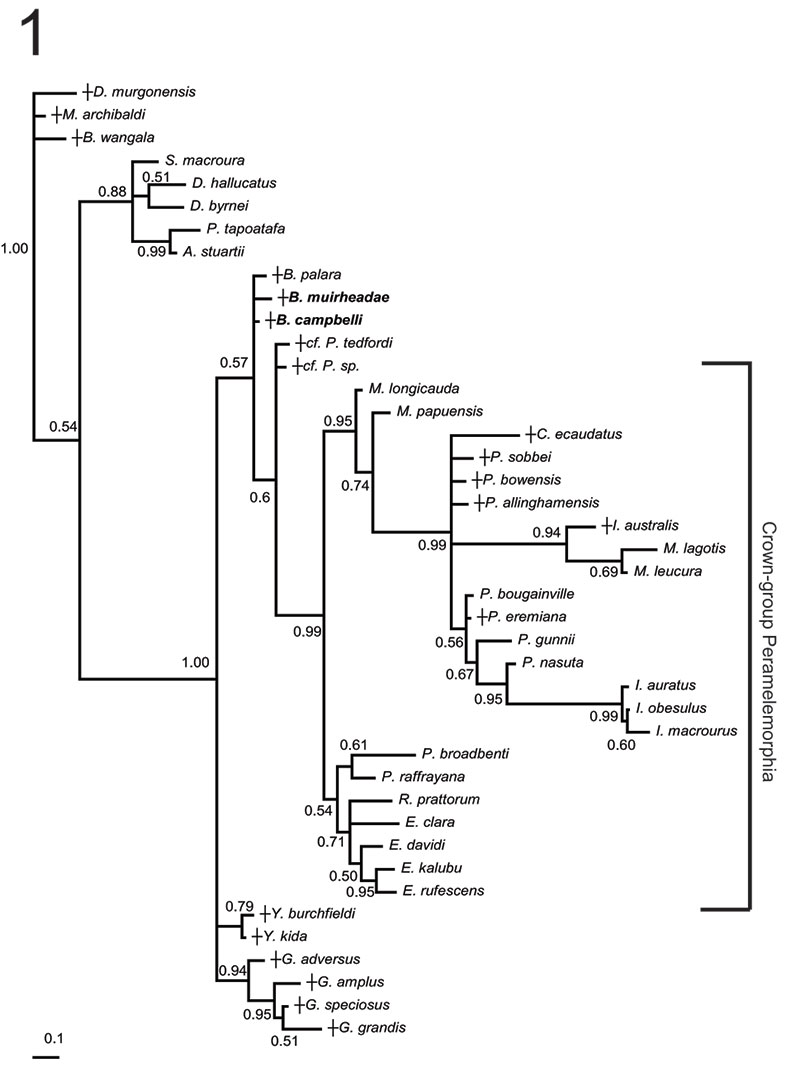
FIGURE 5. Phylogenetic relationships of Bulungu muirheadae and B. campbelli sp. nov. based on our 156 character craniodental matrix. Fossil and recently extinct taxa are indicated by †. Bulungu muirheadae and B. campbelli are highlighted in bold. Crown-group Peramelemorphia is bracketed. 1, 50% majority rule consensus that results after Bayesian analysis of the matrix assuming the Mk + G model (harmonic mean of the log likelihood of the post-burn-in trees = -2898.10). The analysis was run for five million generations, sampling trees every 100 generations, with a "burn-in" period of 1.25 million generations. Numbers above branches represent Bayesian posterior probabilities. 2, 50% majority rule consensus that results after Bayesian analysis of the matrix is analysed enforcing a "backbone" molecular scaffold based on Westerman et al. (2012), assuming the Mk + G model (harmonic mean of the log likelihood of the post-burn-in trees = -2933.45). The analysis was run for five million generations, sampling trees every 100 generations, with a "burn-in" period of 1.25 million generations. Numbers above branches represent Bayesian posterior probabilities.