FIGURE 1. 1: Active geodynamic map of eastern Mediterranean region and location of the study area (Kaymakçı et al., 2010). 2: Geologic map of the Sivas Basin simplified from 1/500.000 scale geological map sheet of Directorate of Mineral Research and Exploration, with location of the Hayranlı locality. 3: Stratigraphical column of the fossil bearing İncesu Formation and vertical distribution of the important localities. 4: Satellite image of the Hayranlı study area with location of the selected localities.
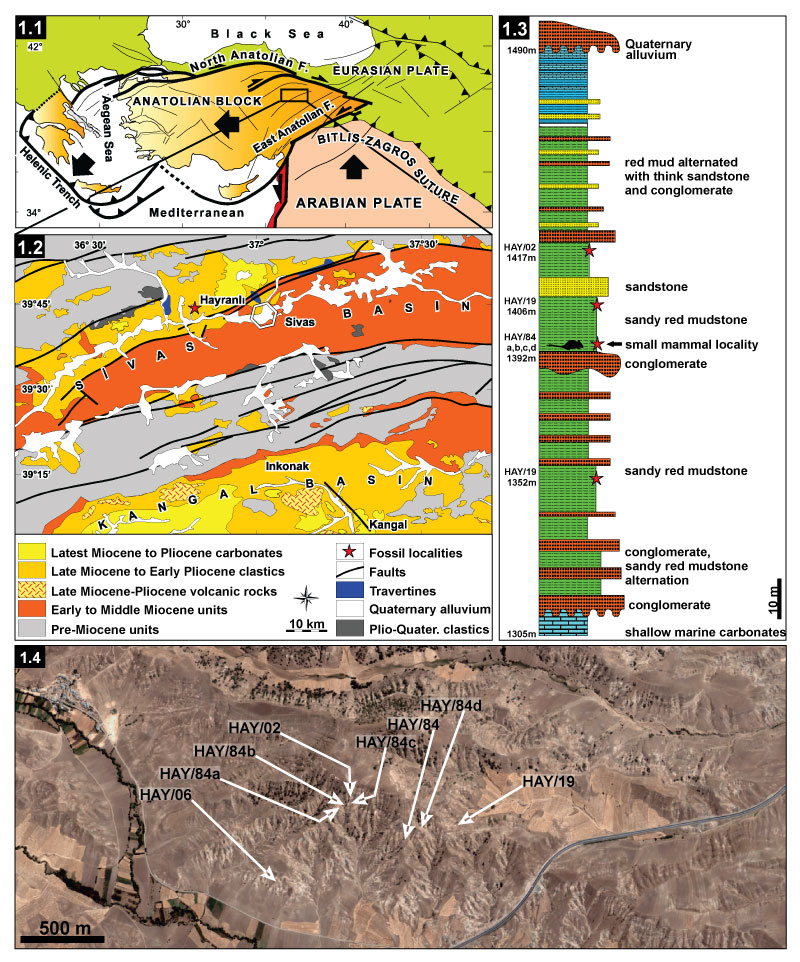
FIGURE 2. Nomenclature of parts of the Gliridae cheek teeth (after Daams, 1981 and Garcia-Paredes et al., 2010).
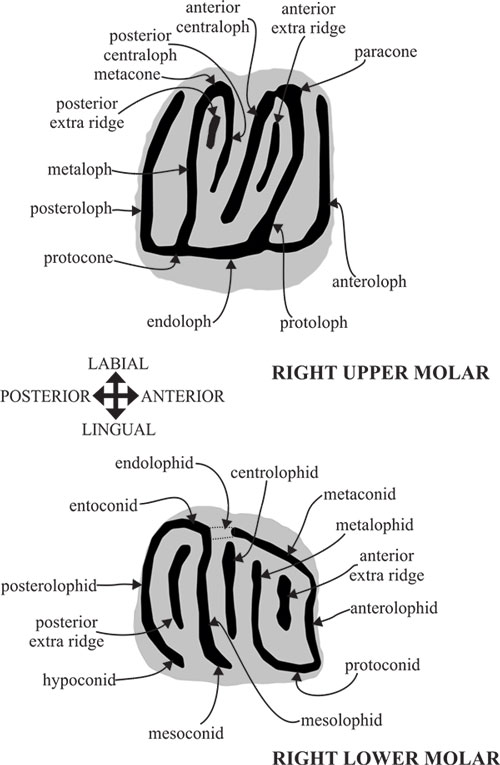
FIGURE 3. Upper and lower cheek teeth attributed to Myomimus maritsensis from Hayranlı. Upper dentition: 1-3 P4; 5-8 M1; 9-12 M2; 4 M3. Lower dentition: 13 p4; 14-19 m1; 20-24 m2 and 25, 26 m3. All the teeth are pictured at the same magnification and as if they were from the right side; figure letters are underlined for inverted teeth.
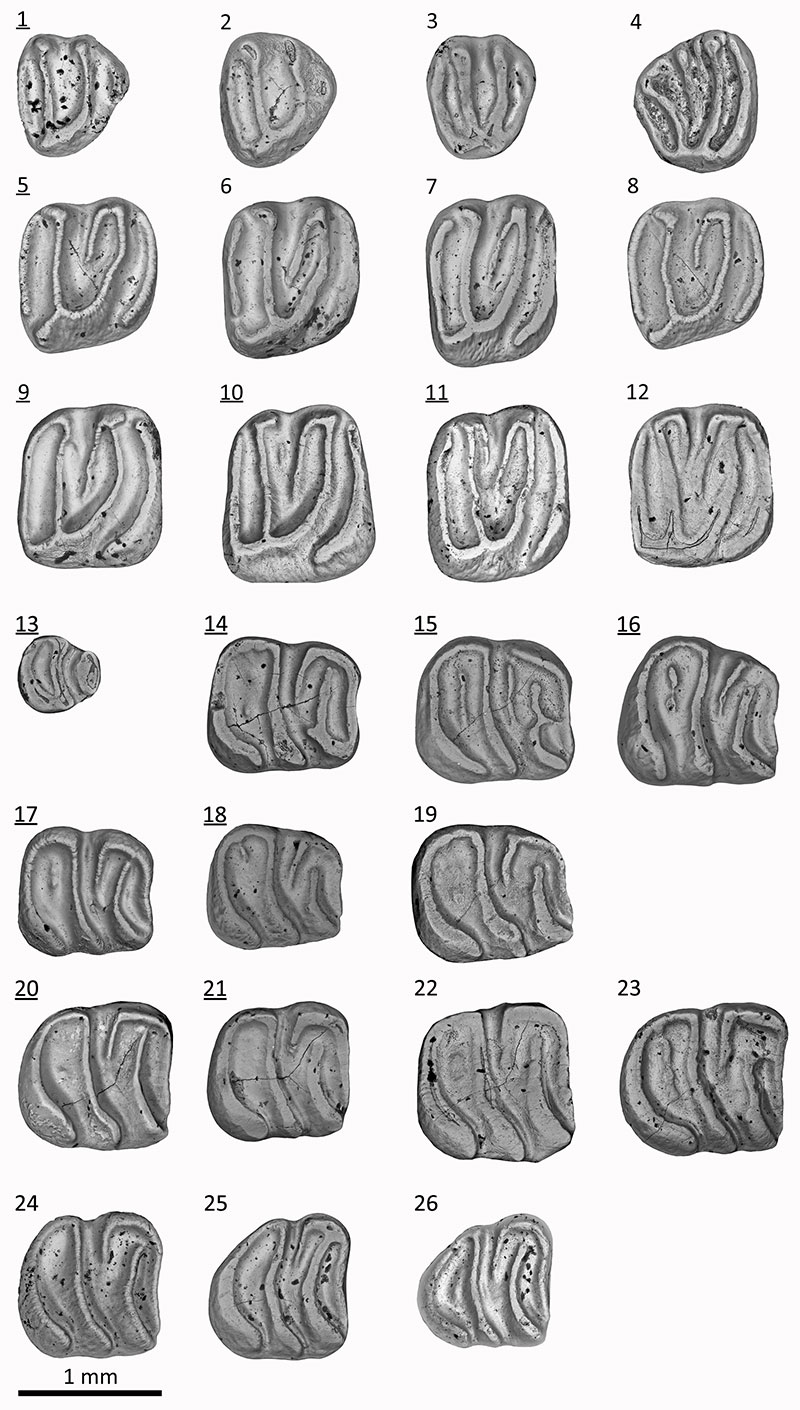
FIGURE 4. Upper and lower cheek teeth attributed to Microdyromys koenigswaldi from Hayranlı. Upper dentition: 1 P4; 2 and 3 M1/2. Lower dentition: 4 M1 and 5 M2. All the teeth are pictured at the same magnification and as if they were from the right side; figure letters are underlined for inverted teeth.
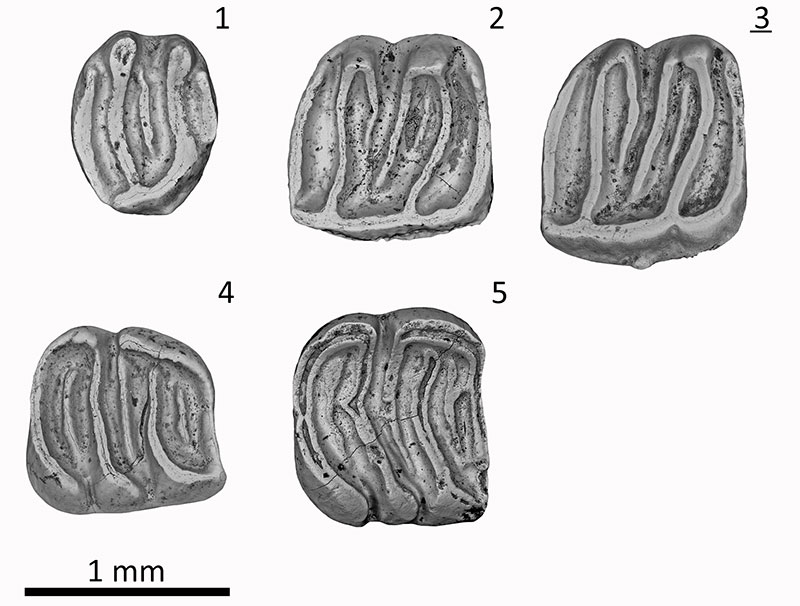
FIGURE 5. Spatial distribution of 1: Microdyromys; 2: Peridyromys; and 3: Myomimus genera from the Oligocene to the Pliocene (updated data from NOW database (Fortelius, 2013)).
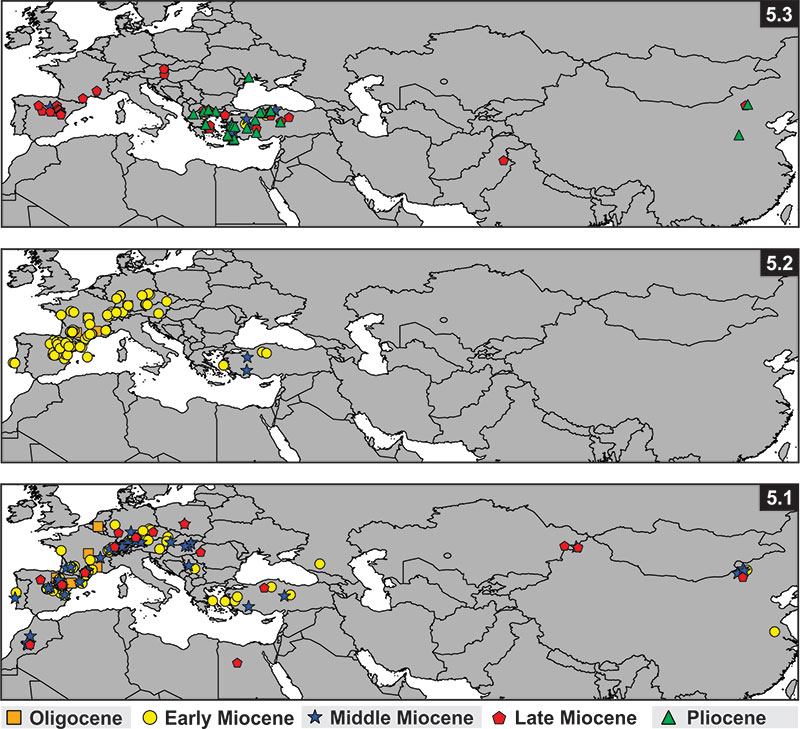
FIGURE 6. 1: Position of the hypoconid on glirid's second lower molar; 2: SEM photomicrograph at 450x of the dental facet surface showing microwear patterns. SEM photomicrographs of the hypoconid of the second lower molar, 3: Myomimus maritsensis; 4: Microdyromys koenigswaldi.
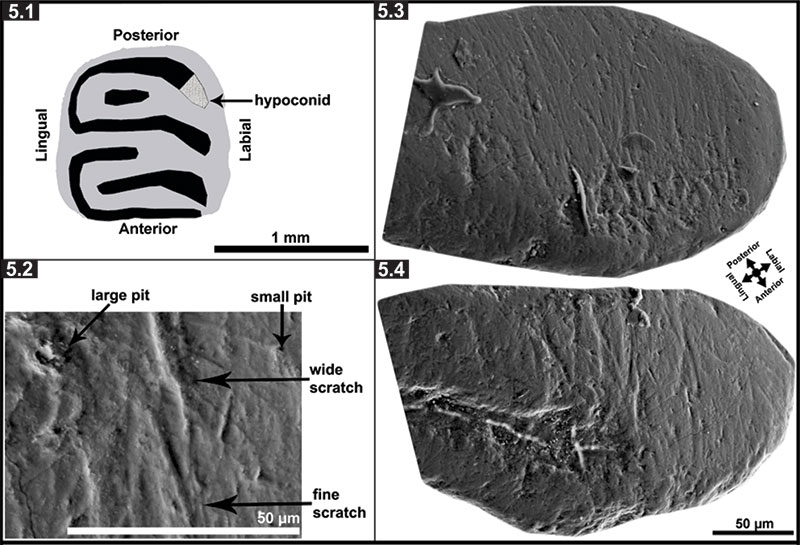
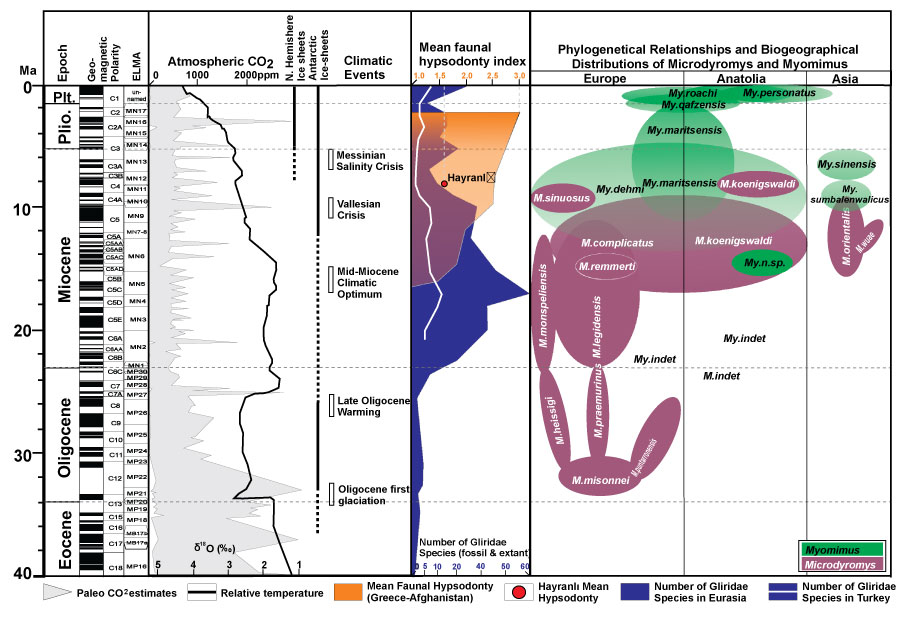
FIGURE 7. Abundance of Gliridae species from the entire fossil and extant records (updated after Daams and De Bruijn, 1995; NOW Database (Fortelius, 2013) in the context of Cenozoic trends in average temperature and atmospheric CO2 (Strömberg, 2011; Royer, 2006). Relative temperature estimates during the last 40 Ma, Northern Hemisphere and Antarctic ice sheets (the dashed bar represents periods of minimal ice coverage and the full bar represents close to maximum ice coverage) ollows those of Zachos et al. (2001) and Strömberg (2011). The mean faunal hypsodonty index of all large herbivorous-omnivorous mammal taxa (from Greece-Afghanistan) follows Fortelius et al. (2002), Eronen et al. (2009, 2010a, b), and Strömberg (2011). The phylogenetic relationship of the Microdyromys is modified from Freudenthal and Martin-Suarez (2007a) and Daams (1981). Abbreviations: ELMA, European Land Mammals Age; Ma, million years; Plio., Pliocene; Plt., Pleistocene.