FIGURE 1. Homothetic and quasi-homothetic transformation.
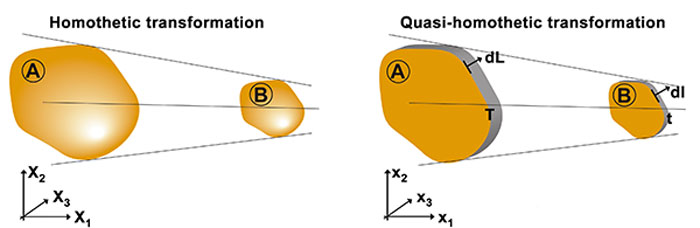
FIGURE 2. Boundary conditions, forces applied in the reference model A and the scaled model B and location of points P and Q in the jaw.
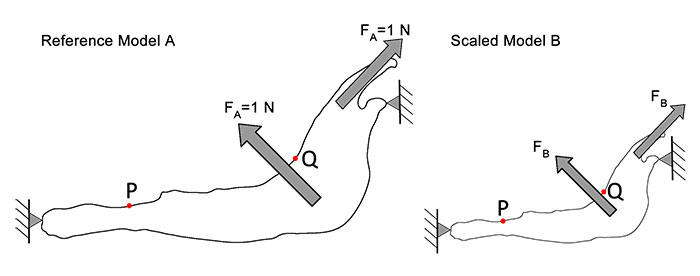
FIGURE 3. Von Mises Stress distribution (in MPa) and Displacement distribution (in mm) in the four scaled models of Connochaetes taurinus analyzed for plane stress and plane strain.
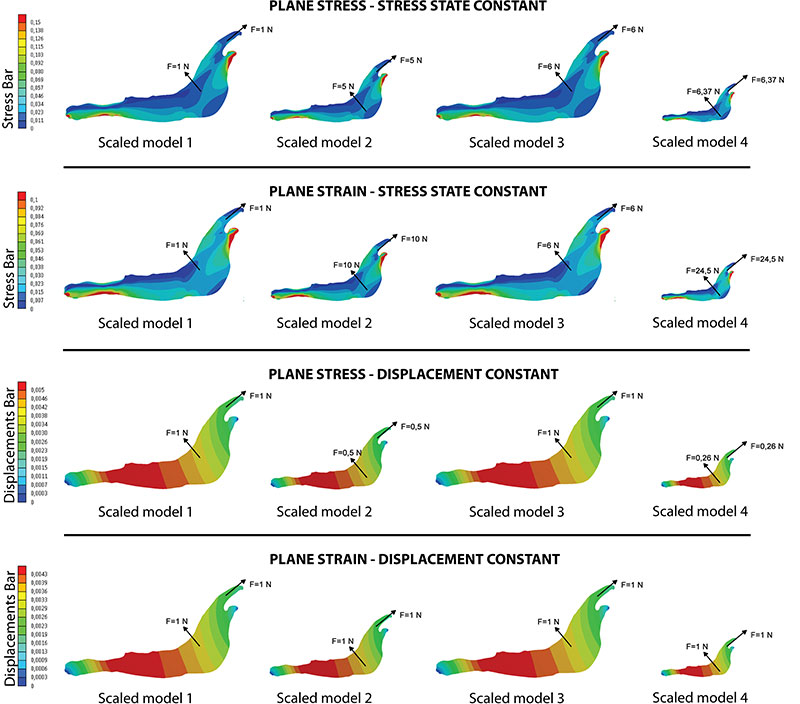
FIGURE 4. Von Mises Stress distribution (in MPa) and Displacement distribution (in mm) in the four different models for plane stress and plane strain when a unitary force is applied in all the models.
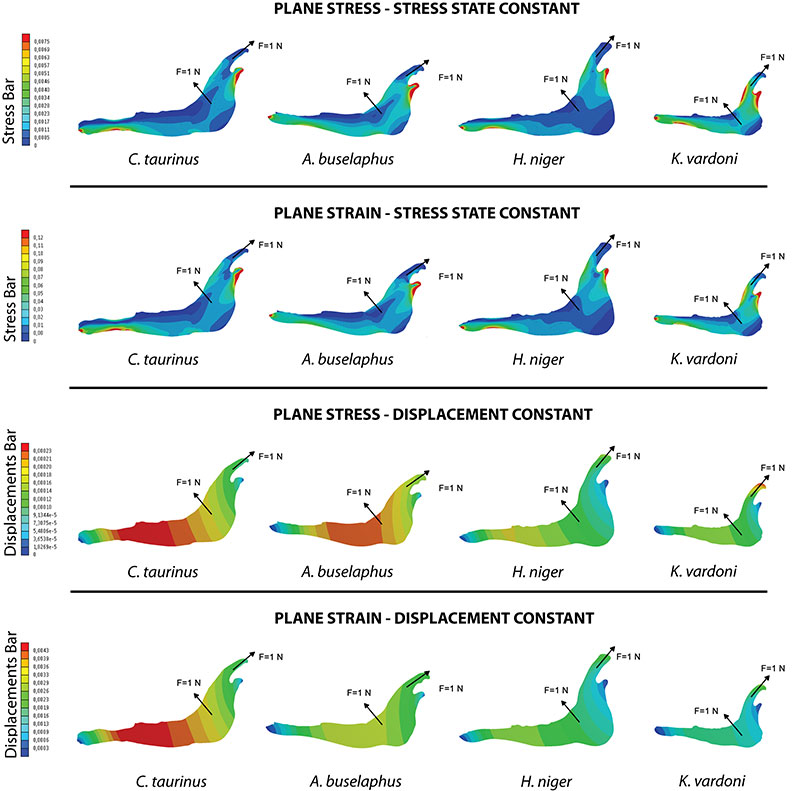
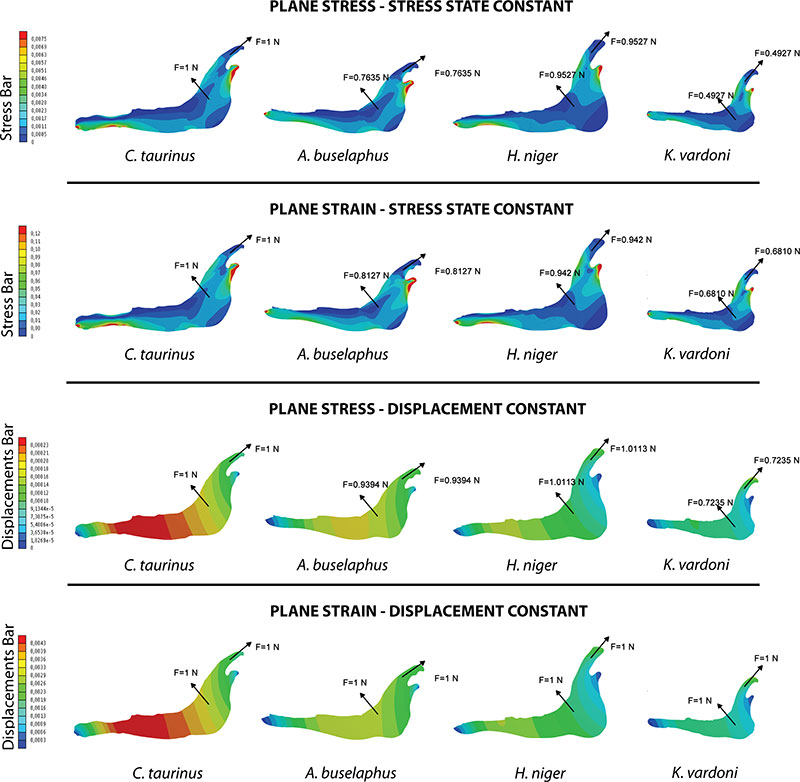
FIGURE 5. Von Mises Stress distribution (in MPa) and Displacement distribution (in mm) in the four different models for plane stress and plane strain when the quasi-homotetic transformation was applied.