FIGURE 1.Eocenoxenos palintropos gen. nov. et sp.nov. 1.1: inclusion in amber, left lateral view, 1.2: micro-CT scan, reconstruction in VGL, ventral view.
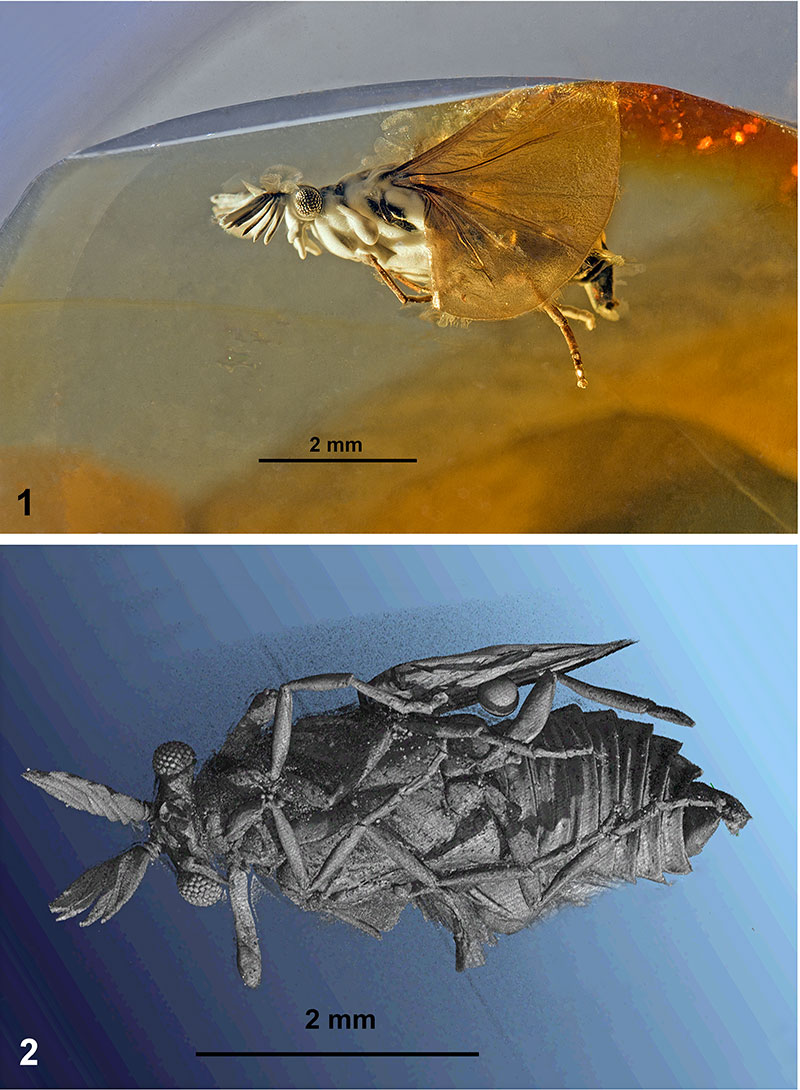
FIGURE 2. Eocenoxenos palintropos gen. nov. et sp.nov. 2.1: head with antenna, right lateral view. 2.2: Acrylonitrile butadiene styrene (ABS) 3D model with fused depositioning modeling (10 cm large, layers of 0.254mm). 2.3: prothoracic leg. 2.4: mesothoracic leg. 2.5: metathoracic leg. 2.6: micro-CT scan reconstruction of right antenna, ventral view, with numbered antennomeres. 2.7: micro-CT scan reconstruction of left antenna, ventral view, with numbered antennomeres.
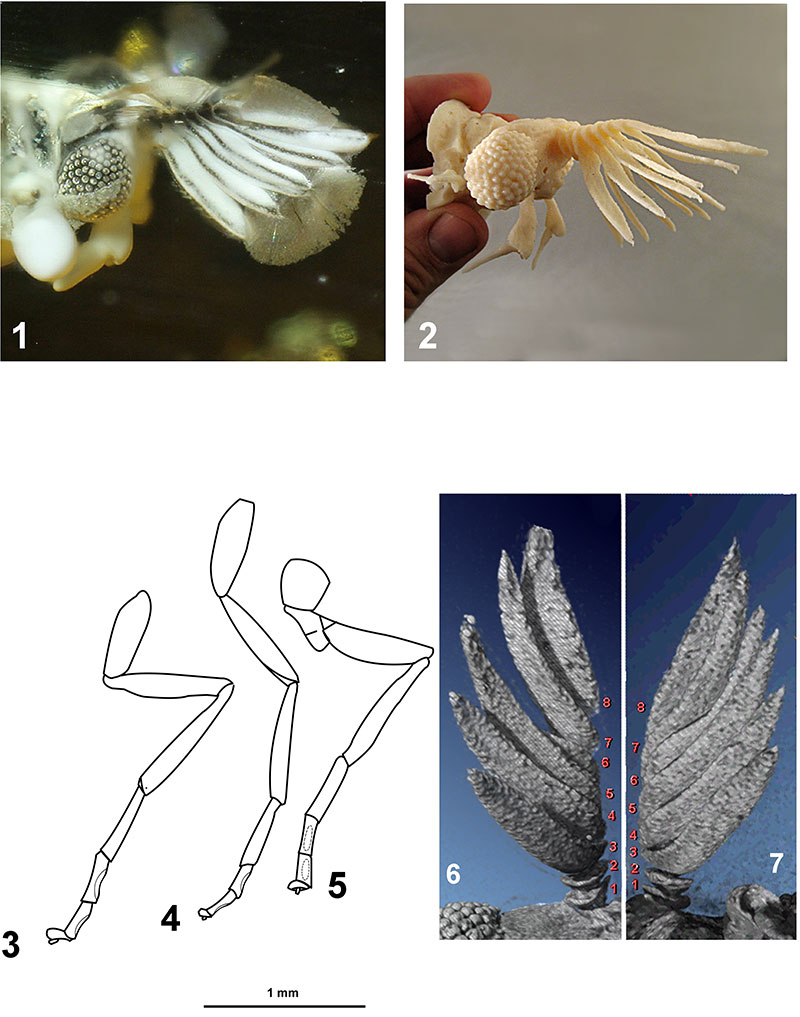
FIGURE 3.Eocenoxenos palintropos gen. nov. et sp.nov. (holotype). 3.1: head with antenna, dorsal view, in amber. 3.2: black 3D model with polyjet modelling (5,5 cm large, layers of 0.028 mm, VeroBlack Plus), dorsal view. 3.3: Acrylonitrile butadiene styrene (ABS) 3D model with fused depositioning modeling (10 cm large, layers of 0.254 mm), ventral view. 3.4: as 3.2, dorso-lateral view.
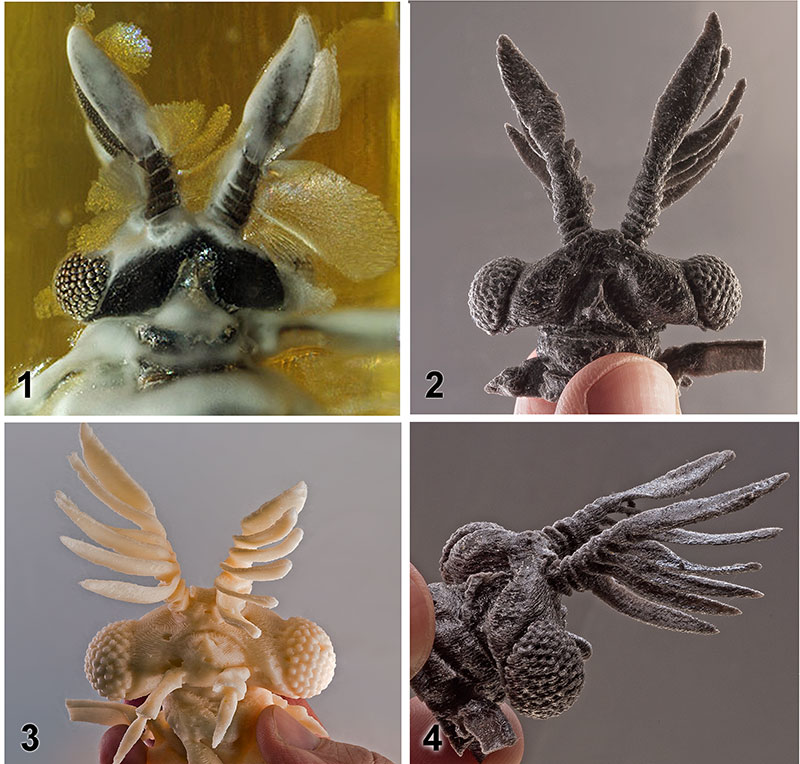
FIGURE 4. Eocenoxenos palintropos gen. nov. et sp.nov. male holotypus. (Figure 4.1- 4.5: micro-CT scan reconstruction). 4.1: tarsi of left prothoracic leg, position of sensorial spots indicated, latero-dorsal view. 4.2: left prothoracic leg, terminal tarsal segments. 4.3: left prothoracic leg, latero-ventral view, sensorial spots indicated. 4.4.: left mesothoracic leg, latero-ventral view, sensorial spots indicated. 4.5: left metathoracic leg, latero-ventral view, sensorial spots indicated. 4.6: left metathoracic leg, optical view in amber, ventral, sensorial spots indicated.
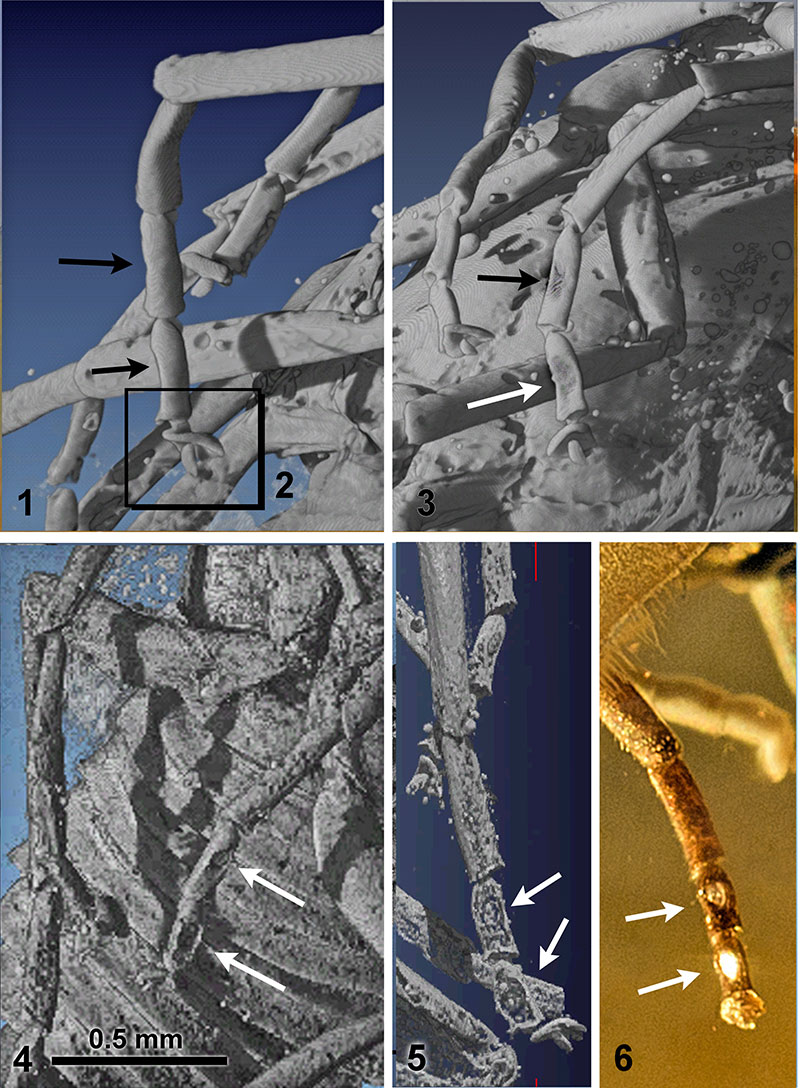
FIGURE 5.Eocenoxenos palintropos gen. nov. et sp.nov. male holotypus. 5.1: habitus, reconstruction; 5.2: head, frontal view, 5.3: abdominal segments with penis.
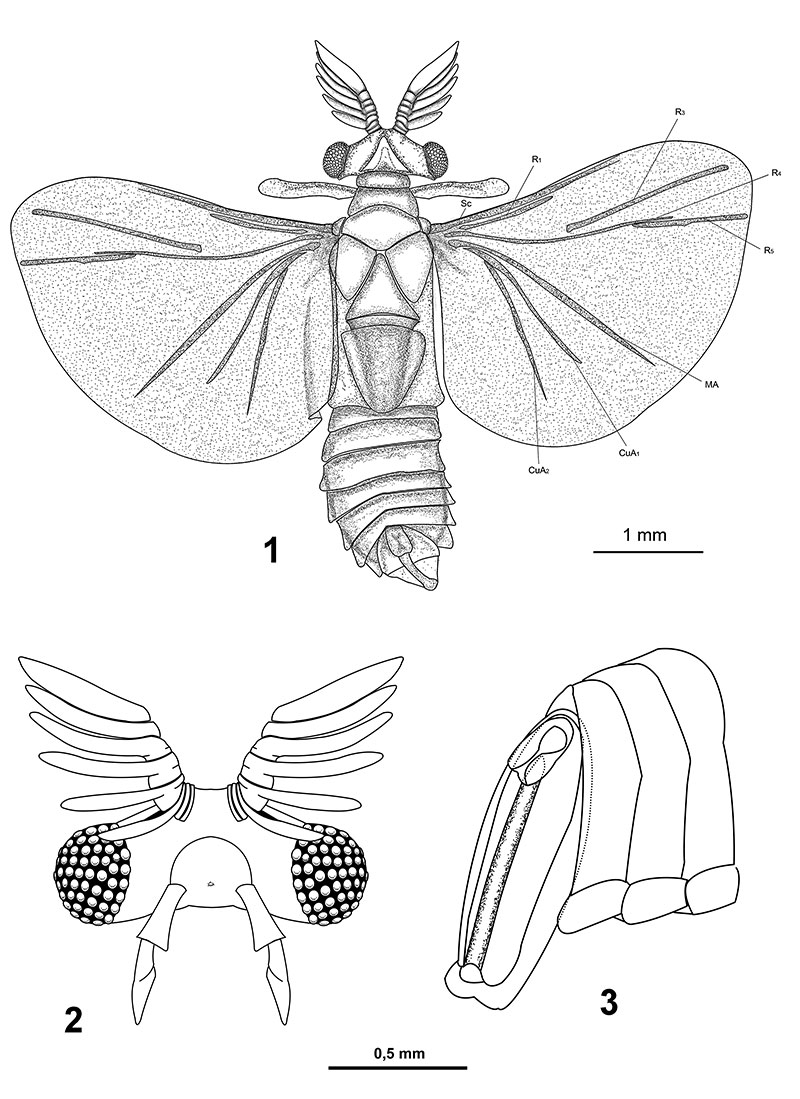
FIGURE 6. Strict consensus tree of the 12 fittest trees obtained under implied weighting. State changes are indicated on the tree for 44 characters (see Appendix). Non-homoplasious character state changes are in black, homoplasious state changes in white. Nodes are numbered on the tree and Goloboff fit Bremer support values, as calculated in both TNT and PAUP/TreeRot, are indicated in italics below branches.
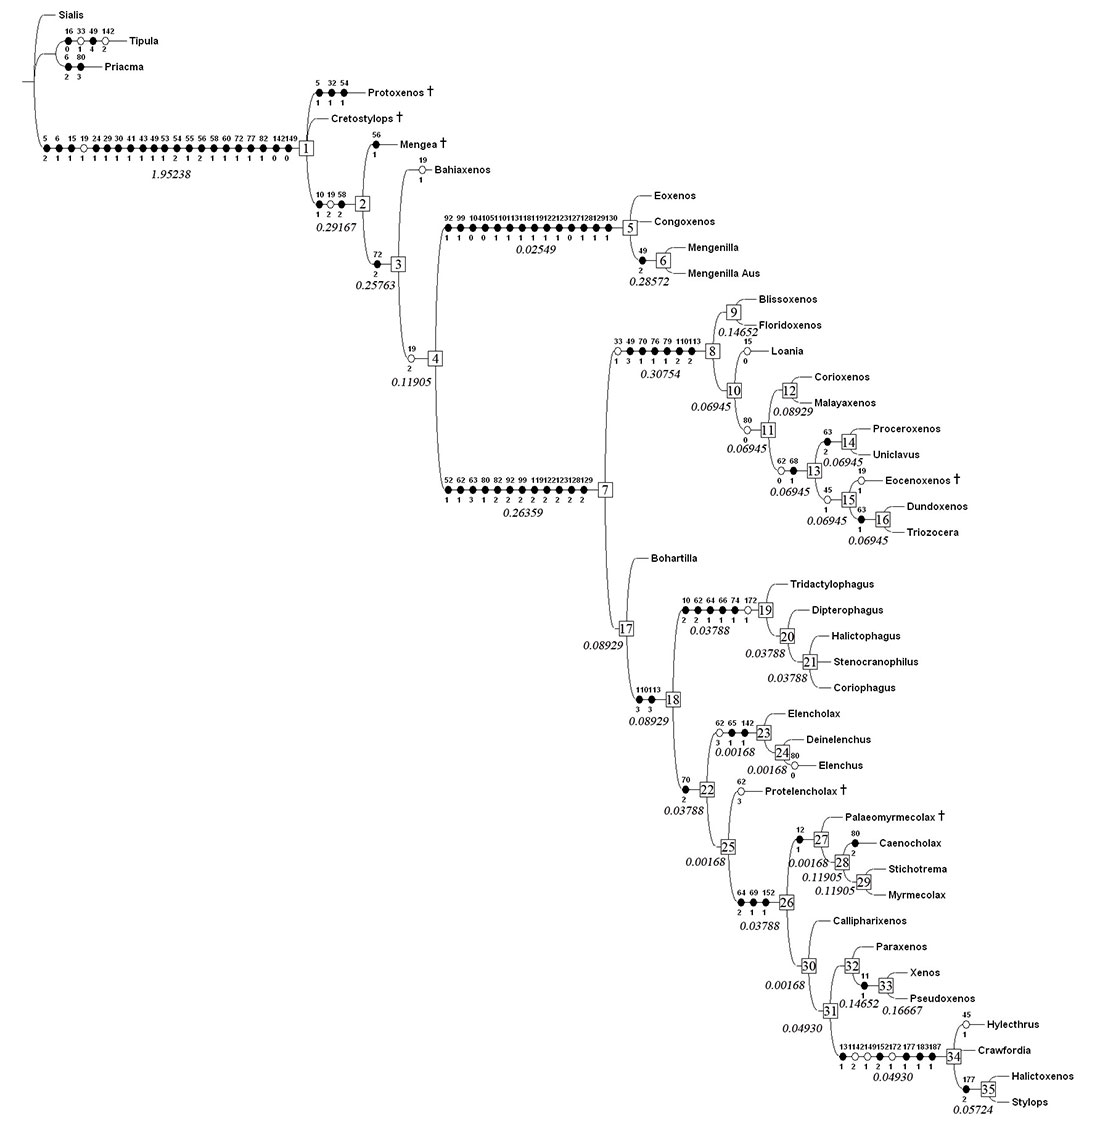
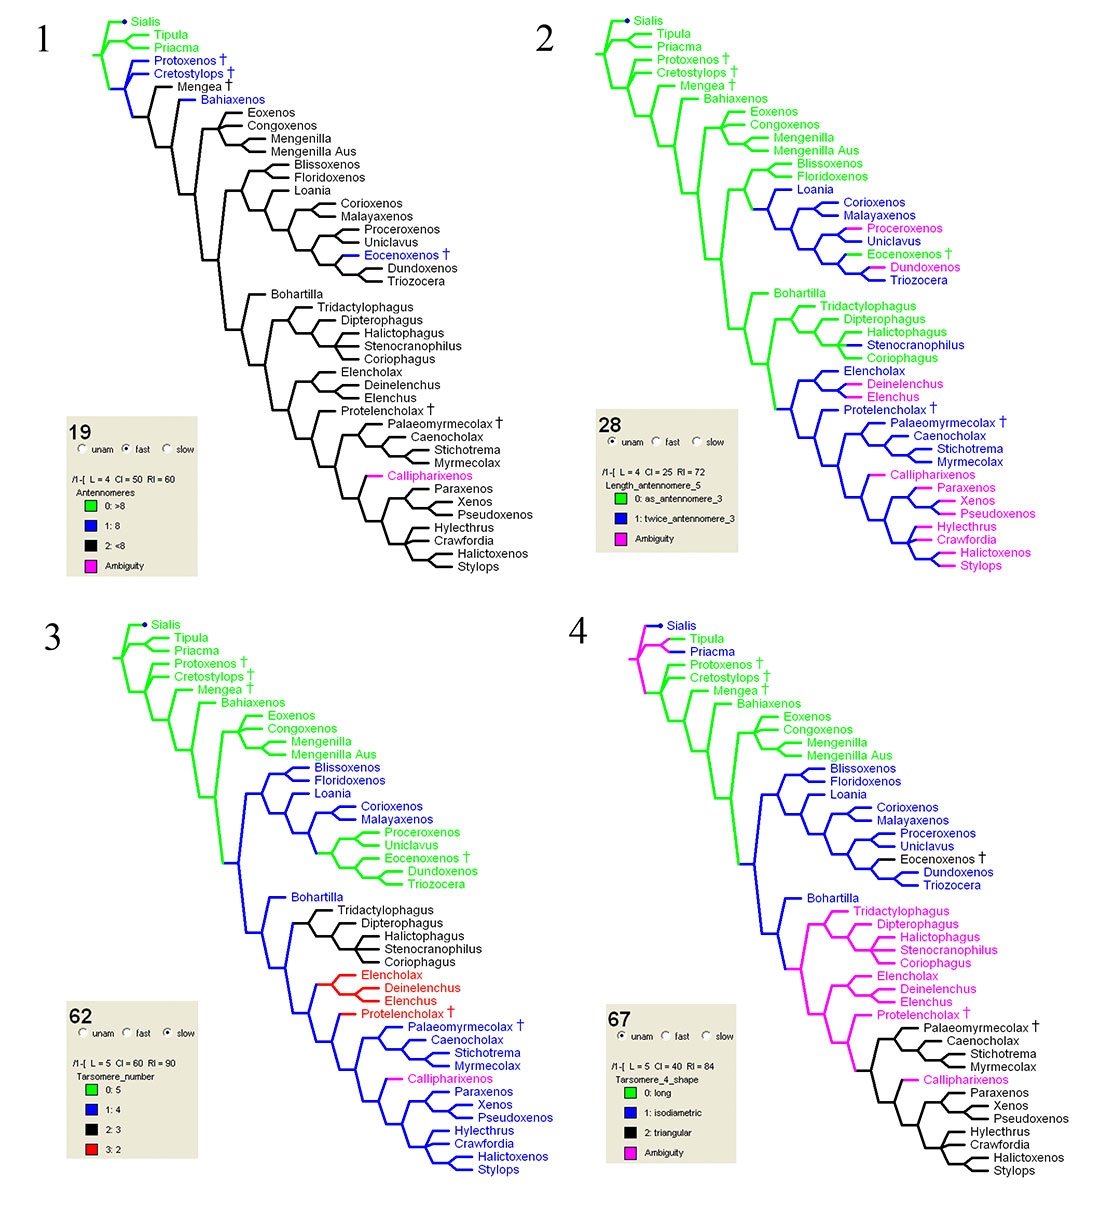
FIGURE 7. Character state distribution of four characters on the consensus tree. 7.1: Char. 19, ACCTRAN; 7.2: Char. 28, UNAMB; 7.3: Char. 62, DELTRAN; 7.4: Char. 67, UNAMB.