 Wavelet analysis of ammonoid sutures
Article number: 17.1.9A
https://doi.org/10.26879/381
Copyright Paleontological Society, February 2014
Author biographies
Plain-language and multi-lingual abstracts
PDF version
Submission: 2 March 2013. Acceptance: 4 February 2014
{flike id=678}
ABSTRACT
A morphometric method based on a continuous wavelet transform is introduced for describing the form of ammonoid suture lines. A series of y-coordinate data along the suture line placed in a common reference system was used as the descriptor function of the cumulative chordal length along the suture line. The wavelet transform is defined as an inner product between the descriptor function and a finite-length localized waveform, termed a "daughter wavelet." The absolute values of wavelet transforms, or amplitudes, were computed for individual daughter wavelets with various wavelengths and positions, and a series of amplitudes for different frequencies was used as a shape function in characterizing the suture shape and was summarized into a few principal components.
Takao Ubukata. Institute of Geosciences, Shizuoka University, Oya 836, Surugaku, Shizuoka 422-8529, Japan. sbtubuk@ipc.shizuoka.ac.jp
Kazushige Tanabe. University Museum, University of Tokyo, Hongo 7-3-1, Bunkyouku, Tokyo 113-0033, Japan. tanabe@um.u-tokyo.ac.jp
Yasunari Shigeta. Department of Geology, National Museum of Nature and Science, Amakubo 4-1-1, Tsukuba 305-0005, Japan. shigeta@kahaku.go.jp
Haruyoshi Maeda. Kyushu University Museum, Hakozaki 6-10-1, Higashi-ku, Fukuoka 812-8581, Japan. maeda@museum.kyushu-u.ac.jp
Royal H. Mapes. Department of Geological Science, Ohio University, Athens, Ohio 45701, USA. mapes@ohio.edu
Keywords: wavelet analysis; morphometrics; suture line; ammonoids
Final citation: Ubukata, Takao, Tanabe, Kazushige, Shigeta, Yasunari, Maeda, Haruyoshi, and Mapes, Royal H. 2014. Wavelet analysis of ammonoid sutures. Palaeontologia Electronica Vol. 17, Issue 1;9A; 17p. https://doi.org/10.26879/381
palaeo-electronica.org/content/2014/678-wavelet-analysis-of-sutures
INTRODUCTION
The ammonoid septum, one of the most sophisticated structures of extinct organisms, is a partition that subdivides the interior of the phragmocone into chambers. Particularly in Mesozoic forms, the periphery of the septum is folded and frilled to form a complex suture line where the septum intersects the shell wall. The functional morphology of the frilled structure is a matter of great controversy and several functional hypotheses have been proposed, e.g., reinforce the shell wall against hydrostatic pressure (Buckland, 1836; Westermann, 1958, 1975; Hewitt and Westermann, 1986, 1997; Jacobs, 1990; Hassan et al., 2002; De Blasio, 2008), buoyancy control (Weitschat and Bandel, 1991; Seilacher and LaBarbera, 1995; Daniel et al., 1997), facilitation of respiration or cameral liquid transport (Pérez-Claros, 2005; Pérez-Claros et al., 2007), aid of muscle attachment to the septum (Henderson, 1984), resistance of the septum to dragging force from the adductor muscle (Lewy, 2002) and so on.
The debate regarding the "ammonoid suture problem" has been based on the following indices that represent the geometric properties of the suture line: Index of Suture Complexity (Westermann, 1971; Ward, 1980; Ballantine, 2007), Intersutural Span (Jacobs, 1990), Sutural Amplitude Index (Batt, 1991), Sutural Complexity Index (Saunders, 1995; Saunders and Work, 1996, 1997; Saunders et al., 1999) and fractal dimension (García-Ruiz et al., 1990; Boyajian and Lutz, 1992; Lutz and Boyajian, 1995; Olóriz and Palmqvist, 1995; Checa and García-Ruiz, 1996; Olóriz et al., 1997, 2002; Pérez-Claros et al., 2002, 2007), among others. However, these indices are somewhat ambiguous because disparate suture forms are commonly represented by similar index values (Allen, 2006).
Manship (2004) and Yacobucci and Manship (2011) used Geographic Information Systems in recognizing suture patterns, but this approach was designed for the identification of suture patterns using pattern-matching techniques rather than for the description of suture shape itself. One promising approach in this regard is a Fourier-based method in which a series of morphometric data transformed into a oscillating function is decomposed into sine and cosine functions with various frequencies (Canfield and Anstey, 1981; Gildner, 2003); however, the predominant frequency commonly changes with location along the suture line, and a conventional Fourier analysis tends to fail to catch signals with non-stationary frequency. Allen (2006, 2007) proposed a further sophisticated approach for analyzing non-stationary suture folds, using a windowed short-time Fourier transform in which the transformed signal is multiplied by a window function that is moved along the signal. The short-time Fourier transform provides a two-dimensional representation of a suture form in terms of location and frequency, but it provides all frequencies with a constant resolution because the width of the window is fixed. This approach involves a trade-off between location resolution and frequency resolution.
In the present study, we introduce an alternative method for the comparison of suture forms among ammonoids, based on a wavelet transform. The method proposed herein is also applicable for suture shape of nautiloids as well as ammonoids.
WAVELET ANALYSIS OF INTRICATE OPEN CURVES
 Continuous Wavelet Transform for Morphometrics
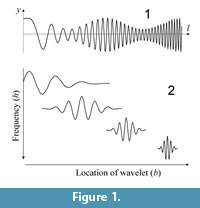
Wavelet analysis, primarily a method for analyzing a time series, can be regarded as an extension of Fourier analysis. It is performed by simultaneously decomposing a time series into time and frequency domains. Wavelet analysis enables the analysis of different frequencies with different time resolutions, whereas short-time Fourier analysis provides all frequencies at a constant resolution. A finite-length localized oscillating waveform, or mother wavelet, is scaled and translated to generate daughter wavelets with various wavelengths placed along the time axis (Figure 1). The wavelet transform is given by an inner product between the signal and a daughter wavelet for each position in the time–frequency space. The wavelet transform was first used as a morphometric tool to characterize localized changes in a closed outline of organic form (Takemura et al., 2004; Lestrel et al., 2005). Lestrel et al. (2005) used a series of coordinate data along the outline curve as a descriptor function instead of a time series data.
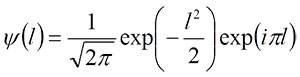
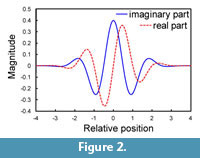 Wavelet transforms are generally dependent on the locations where daughter wavelets are sampled; consequently, a slight shift in a descriptor function leads to a marked change in the values of wavelet coefficients (Bradley, 2003). One approach to minimizing the shift variance is to use a complex wavelet transform in which a pair of wavelets with different phases constitutes the real and imaginary components. The Morlet wavelet (or the equivalent Gabor wavelet) is most commonly used among complex wavelets, and was employed in the present study (Figure 2). Its mother wavelets are defined by
 ,
,
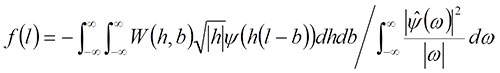
where i is the imaginary unit and l is the relative position with respect to the target wave, which is represented by the cumulative chordal length along the curve (Goupillaud et al., 1984; Walker, 1999). If the descriptor function of the target waveform is expressed by f(l), a continuous wavelet transform for each frequency (h; equivalent to inverse of scale) and location (b) is given by
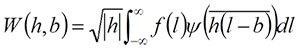 (1)
(1)
(Walker, 1999; Hammer and Harper, 2006). Note that while l is a parameter of the descriptor function, b is a constant that represents a property of each daughter wavelet, although both represent the location along the target wave. In morphometric measurements, original coordinate data obtained from the curve are discretely sampled along the curve. For a discretely sampled waveform, fm, equation (1) can be rewritten as
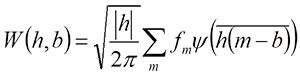
if the sampled points are evenly spaced. A scalogram of wavelet transform, which corresponds to the energy spectrum of a Fourier transform, can be obtained for each daughter wavelet as a square of the wavelet transform:
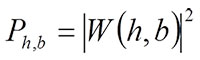 .
.
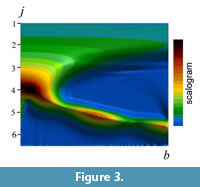 The term 'scalogram' is also used to indicate a visual representation of the wavelet spectrum of frequencies as well as the spectrum itself. A set of scalograms (in the sense of spectrum) indicates the predominant frequency for each location along the target wave and can be depicted as a contour plot in the frequency (h)–location (b) domain (Figure 3). An inverse transform of equation (1) can be given by:
 , (2)
, (2)
where ![]() is the Fourier transform of (l). The inverse wavelet transform allows us to produce a synthetic curve using a given number of frequencies. For details of continuous wavelet analysis, see Grossmann and Morlet (1984), Goupillaud et al. (1984) and Walker (1999).
is the Fourier transform of (l). The inverse wavelet transform allows us to produce a synthetic curve using a given number of frequencies. For details of continuous wavelet analysis, see Grossmann and Morlet (1984), Goupillaud et al. (1984) and Walker (1999).
PROCEDURE OF MORPHOMETRIC ANALYSIS OF SUTURE FORM
To assess the usefulness of wavelet analysis for morphometrics of ammonoid sutures, we attempted application of wavelet description to the suture lines of 115 specimens from 115 species belonging to 63 families (Appendix). The material covers six ammonoid orders spanning from the Devonian to the Cretaceous. All the specimens examined are preserved in the University Museum of the University of Tokyo (UMUT), Ohio University (OUZC) or Shizuoka University (SUM).
Decomposition of Suture Geometry into Frequency–Location Domain
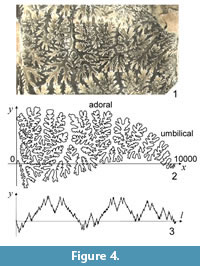 A piece of the external hemi-suture was analyzed for each sub-adult individual. The shell wall was carefully removed from each specimen using a small cutting knife to expose suture lines. To capture an image of the suture line, each portion of the external surface of each specimen was photographed using a Keyence VH-5000 CCD camera, viewed perpendicular to the surface of the portion. The CCD camera was attached to a standing arm that could be tilted to the right or left so as to capture images from a known angle of offset (Ubukata, 2004). The camera and its controller were connected to a personal computer via USB, and each image was saved as a computer bitmap file using the Keyence PictureFolder© program. Captured images were pieced together to form a synthetic image of the external hemi-suture, using Justsystem Hanako PhotoRetouch© software on a personal computer (Figure 4.1).
The three-dimensional suture curve was then "rolled out" onto a two-dimensional plane. A series of x- and y-coordinate data along the suture line was then collected using a digitizing program (Ubukata, 2004). The digitized figure was placed in an x–y coordinate system by placing the point of the ventral extreme onto the origin of the coordinate, placing the straight line traced from the venter to umbilical seam along the x-axis, and scaling the figure so that the distance between the ventral and umbilical extremes was 10,000 pixels long (Figure 4.2). Subsequently, 4,096 equally spaced points were interpolated along the series of normalized coordinate points by a cubic spline (Rohlf, 1990) using a program written in Visual Basic (Ubukata and Sugino, 2007).
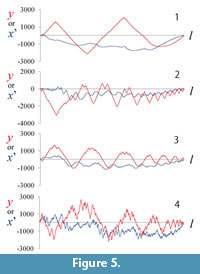 Because the suture curve is depicted in an x–y coordinate system by placing both its extremes along the x-axis, the series of y coordinates repeat with a period corresponding to the length of the whole suture line (Figure 4.3); however, the series of the x function does not satisfy the periodic boundary condition, and the introduction of periodicity to the x function requires an additional transformation, such as detrending by subtracting the expected linear increase in x (Ubukata et al., 2010). In multivariate statistical analyses, use of both x and y functions yields a greater number of coefficients that are in part redundant, meaning that subsequent statistical analyses are compromised (Haines and Crampton, 2000). An alternative approach is to use the tangent angle function as a descriptor (Haines and Crampton, 2000; Allen, 2006); however, any analysis of an intricate curve using the tangent angle function is readily distorted by high-frequency noise because the tangent Fourier descriptor is based on a series of differences between adjacent points. In the case of a meandering curve along the x-axis (e.g., an ammonoid suture), amplitude of y function is much greater than that of x function (Figure 5), and y function well represents the predominant frequencies of the wave component for each location along the curve. Therefore, in the present study we adopted a series of y-coordinate data to obtain a scalogram. As mentioned below, calculation of the inverse wavelet transform requires the inclusion of a series of x functions after detrending (Ubukata et al., 2010).
In a continuous wavelet transform, h and b in equation (1) can generally take the value of any real number. To represent the curve geometry using a finite number of coefficients in a statistical analysis, we consider the restrictive case for which the frequency per cycle of the target waveform (h) is given by a list of 2j-1 numbers (1, 2, 4,..., 2048) and for which the locations of daughter wavelet (b) is given by a series of 17 equally spaced positions between two extremes along the suture curve. A series of square-roots of scalograms for each j and b, tentatively called amplitudes for j and b, describes the change in magnitude of the jth lowest frequency with location along the curve (b) and defines a 'shape function' for the ith individual. The amplitudes of a series of y coordinates were computed for each frequency of each individual to obtain shape functions of suture lines using an original program written in Visual Basic.
In order to assess random error in measurement, all procedures of measurements were repeated for the identical suture of a single individual so as to obtain a set of the reproduced shape functions. This repetition was performed 10 times using a specimen of Gaudryceras striatum.
Reconstruction of Suture Shape Using Inverse Wavelet Transform
Wavelet transforms of a series of x coordinates were also obtained after being detrended by subtracting the expected linear increase in x (Ubukata et al., 2010). To visualize suture models represented by a given number of frequencies, inverse wavelet transforms were calculated by equation (2) from the wavelet transforms of series of x and y coordinates. A series of x-coordinate data was reconstructed by the inverse wavelet transform after re-adding the expected linear increase in x, which had been detrended prior to computation of the wavelet transforms. Consequently, the reconstructed x and y coordinates define the shape of the synthetic model.
Ordination of Suture Geometry
To summarize the suture shape into a few dimensional morphospace, a principal component analysis (PCA) was applied to the shape function. In the present PCA, shape functions for j and b were regarded as variables and similarity between a pair of variables was assessed using the Pearson product-moment correlation coefficient. Principal components were obtained by the eigenvalue decomposition of inter-variable correlation of the shape function. The mean of principal component loadings was computed for each frequency over all locations b to assist in the geometric interpretation of the analytical results. PCA was performed using an add-in program for Microsoft Excel (Esumi Excel Tahenryou-kaiseki ver. 5.0).
RESULTS OF A PILOT ANALYSIS
 Amplitudes and Shape Functions of Suture Lines
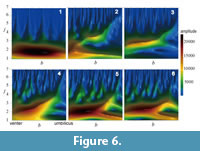
There exists a wide variation in the pattern of contours that represents the amplitudes of wavelet transforms on suture shape, even if the patterns are compared within a single ammonoid order (Figure 6). The topographic peak of the amplitude is generally located in the ventral, low-frequency region (i.e., lower-left part in each panel in Figure 6). In many ammonitid and some ceratitid species, the topographic ridges are distributed along the diagonal from the lower-left (ventral and lower-frequency) to upper-right (umbilical and higher-frequency) regions in the figure (e.g., Figure 6.3-6). This feature provides a good representation of the change in the predominant frequency of the waveform with location along the suture line; i.e., the primary suture elements tend to decrease in wavelength toward the umbilicus. The more complex the suture line, the more irregular the contours of amplitude. In many ammonitid species, minor valleys and ridges in amplitude run vertically in the high-frequency region (upper part) of the diagram (Figure 6.4-6).
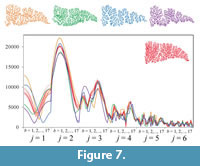 The result of repeated measurements of a single specimen revealed that the shape functions obtained from the identical suture were fairly variable but showed an allowable measurement error to compare suture shape among closely related taxa (Figure 7).
Synthetic suture forms based on the inverse wavelet transform indicate the number of frequencies necessary to reproduce each feature of the original suture form. The synthetic model generated using the lowest frequency (j = 1) depicts a wave that repeats only once within the total span of the curve, while the second lowest frequency (j = 2) represents a wave that repeats twice, the third lowest frequency corresponds to a wave that repeats four times, and so on (Figure 8). Most of the primary suture elements (e.g., lobes and saddles) can be generated in the synthetic models based on the fourth and lower frequencies; however, a series of auxiliary lobes, as typically seen in the Prolecanitida, cannot be reproduced without the fifth or sixth lowest frequency (Figure 8.2). The reproduction of finer elements such as lobules and folioles commonly found in the Ammonitida requires higher frequencies (Figure 8.4-6). In most goniatitic and ceratitic sutures, the basic pattern of suture form can be approximated by the forms of lobes and saddles; consequently, the fifth and higher frequencies have little effect on suture geometry (Figure 8.1-3).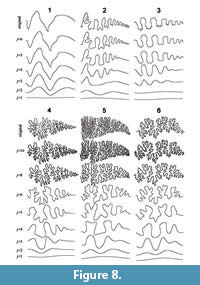 For ammonitic sutures, the synthetic models perform poorly in depicting details of the frilled features of suture lines, unless the eighth and higher frequencies are included in the inverse transform (Figure 8.4-6).
Principal Components Analysis
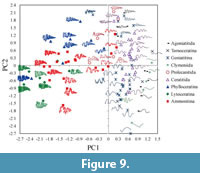
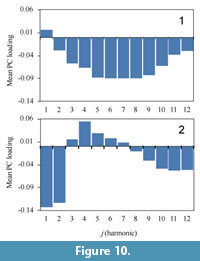
The first and second principal components account for 34.2% and 11.9% of the total variance, respectively. Scatter plots of the first two PC scores showing examples of selected original digitized suture shapes are shown in Figure 9. The mean of the first principal component loadings for each frequency all over locations b indicates that PC1 mainly reflects the difference of middle to higher components represented by the fifth to ninth lowest frequencies (Figure 10.1). Negative perturbations associated with PC1 represent the development of finer elements such as lobules and folioles (Figure 9). The means of the second PC loadings over locations are dominated by lower components of the first and second lowest frequencies (Figure 10.2). As the score proceeds in the negative direction along the PC2 axis, amplitude of primary suture elements becomes prominent (Figure 9); that is, a wide saddle and/or lobe tends to develop. In contrast, an individual with a positive PC2 tends to form a series of auxiliary lobes (Figure 9) that is characterized by a positive value of the fourth lowest frequencies (Figure 10.2).
DISCUSSION
 The wavelet analysis described in the present study represents a powerful tool in describing the detailed features inherent in a sophisticated organic form such as an ammonoid suture line. The patterns in the contour diagrams that depict the amplitudes of wavelet transforms are successful in identifying which wave component is predominant among the suture elements (Figure 6). The reconstructions of suture lines using an inverse wavelet transform indicate that the synthetic models are able to well represent features of primary and/or secondary suture elements in various ammonoid taxa (Figure 8).
Ubukata et al. (2010) attempted an eigenshape-based analysis of suture geometries and accommodated various suture shapes in a morphospace based on the first-order morphological components. However, morphological variation in finer structure was not detected in their eigenshape analysis. The present principal component analysis of amplitudes of wavelet transforms successfully distilled the finer morphological components from complex suture curves and provided the ordinations of wide variation in suture form that are morphologically interpretable (Figure 9). The results of this study demonstrate the utility of a series of wavelet transforms and derivative suture functions as a useful descriptor of suture shape and as an effective basis for comparing differences in suture shape among ammonoids.
 The question of how suture geometry relates to ammonoid shell form has attracted considerable attention in terms of inferring the function of the intricate septa, which is conventionally considered to have helped reinforce the shell wall against hydrostatic pressure (Hewitt and Westermann, 1987; Jacobs, 1990; Saunders, 1995; Saunders and Work, 1996, 1997; Olóriz et al., 2002; Pérez-Claros et al., 2007). The conventional 'strength paradigm' is in part supported by a correlation between suture complexity and external shell form (Hewitt and Westermann, 1987; Jacobs, 1990), but some analyses have failed to demonstrate a clear relation between suture complexity index and gross shell geometry (Saunders, 1995; Saunders and Work, 1996). The various features of intricate suture shape are poorly described by a single-valued index of complexity. Analyses of suture function based on a wavelet transform are considered more sensitive to differences in suture shape than is fractal dimension or other complexity measures and provides us a powerful tool for functional morphology of ammonoid septa.
High-resolution quantification of the form of interest using a wavelet transform may be useful in taxonomy and other fields of comparative morphology as well as functional morphology. The present approach may also enable the quantitative assessment of ontogenetic variations in suture shape, which until now has largely been considered via qualitative descriptions. Synthetic models generated by inverse wavelet transform with a various number of frequencies seem to mimic the ontogenetic change in suture geometry with iterated invagination (Figure 8). The method proposed herein may shed new light on debate on morphogenesis of the complicated ammonoid septum (Hammer, 1999; Checa and García-Ruiz, 2000). Further studies are needed to refine wavelet analysis as a familiar and powerful morphometric tool for capturing rich structures and the ordination of various shapes in a range of organisms.
ACKNOWLEDGMENTS
We thank G. Dera and an anonymous referee for their helpful comments on the first draft. Funding of this work was provided in part by a Grant-in-Aid for Scientific Research from the Japan Society for the Promotion of Science (No. 23540549).
REFERENCES
Allen, E.G. 2006. New approaches to Fourier analysis of ammonoid sutures and other complex, open curves. Paleobiology, 32:299-315.
Allen, E.G. 2007. Understanding ammonoid sutures: new insight into the dynamic evolution of Paleozoic suture morphology, p. 159-180. In Landmann, N.H., Davis, R.A., and Mapes, R.H. (eds.), Cephalopods Present and Past: New Insights and Fresh Perspectives. Springer, Dordrecht.
Ballantine, C.M. 2007. A mathematical analysis of some indices used to classify ammonite shells. Lethaia, 40:197-198.
Batt, R.J. 1991. Sutural amplitude of ammonite shells as a paleoenvironmental indicator. Lethaia, 24:219-225.
Boyajian, G. and Lutz, T. 1992. Evolution of biological complexity and its relation to taxonomic longevity in the Ammonoidea. Geology, 20:983-986.
Bradley, A.P. 2003. Shift-invariance in the discrete wavelet transform, p. 29-38. In Sun, C., Talbot, H., Ourselin, S., and Adriaansen, T. (eds.), Proceedings of the 7th International Conference on Digital Image Computing: Techniques and Applications. The University of Queensland, Brisbane.
Buckland, W. 1836. Geology and Mineralogy Considered with Reference to Natural Theology, Volumes 1 and 2. W. Pickering, London.
Canfield, D.J. and Anstey, R.L. 1981. Harmonic analysis of cephalopod suture patterns. Mathematical Geology, 13:23-35.
Checa, A.G. and García-Ruiz, J.M. 1996. Morphogenesis of the septum in ammonoids, p. 253-296. In Landman, N., Tanabe, K., and Davis, R.A. (eds.), Ammonoid Paleobiology. Prenum, New York.
Checa, A.G. and García-Ruiz, J.M. 2000. Discussion: The development of ammonoid septa: An epithelial invagination process controlled by morphogens or by viscous fingering? Comment. Historical Biology, 14:299-303.
Daniel, T.L., Helmuth, B.S., Saunders, W.B., and Ward, P.D. 1997. Septal complexity in ammonoid cephalopods increased mechanical risk and limited depth. Paleobiology, 23:470-481.
De Blasio, F.V. 2008. The role of suture complexity in diminishing strain and stress in ammonoid phragmocones. Lethaia, 41:15-24.
García-Ruiz, J.M., Checa, A., and Rivas, P. 1990. On the origin of ammonite sutures. Paleobiology, 16:349-354.
Gildner, R.F. 2003. A Fourier method to describe and compare suture patterns. Palaeontologia Electronica, 6.1:12pp, 4.1MB; http://palaeo-electronica.org/paleo/2003_1/suture/issue1_03.htm
Goupillaud, P., Grossmann, A., and Morlet, J. 1984. Cycle-octave and related transforms in seismic signal analysis. Geoexploration, 23:85-102.
Grossmann, A. and Morlet, J. 1984. Decomposition of Hardy functions into square integrable wavelets of constant shape. SIAM Journal on Mathematical Analysis, 15:723-736.
Haines, A.J. and Crampton, J.S. 2000. Improvements to the method of Fourier shape analysis as applied in morphometric studies. Palaeontology, 43:765-783.
Hammer, Ø. 1999. The development of ammonoid septa: An epithelial invagination process controlled by morphogens? Historical Biology, 13:153-171.
Hammer, Ø. and Harper, D. 2006. Paleontological Data Analysis. Blackwell Publishing, Oxford.
Hassan, M.A., Westermann, G.E.G., Hewitt, R.A., and Dokainish, M.A. 2002. Finite-element analysis of simulated ammonoid septa (extinct Cephalopoda): septal and sutural complexities do not reduce strength. Paleobiology, 28:113-126.
Henderson, R A. 1984. A muscle attachment proposal for septal function in Mesozoic ammonites. Palaeontology, 27:461-486.
Hewitt, R.A. and Westermann, G.E.G. 1986. Function of complexly fluted septa in ammonoid shells I. Mechanical principles and functional models. Neues Jahrbuch für Geologie und Paläontologie, Abhandlungen, 172:47-69.
Hewitt, R.A. and Westermann, G.E.G. 1987. Function of complexly fluted septa in ammonoid shells II. Septal evolution and conclusions. Neues Jahrbuch für Geologie und Paläontologie, Abhandlungen, 174:135-169.
Hewitt, R.A. and Westermann, G.E.G. 1997. Mechanical significance of ammonoid septa with complex sutures. Lethaia, 30:205-212.
Jacobs, D.K. 1990. Sutural pattern and shell stress in Baculites with implications for other cephalopod shell morphologies. Paleobiology, 16:336-348.
Lestrel, P.E., Cesar, R.M., Jr., Takahashi, O., and Kanazawa, E. 2005. Sexual dimorphism in the Japanese cranial base: a Fourier-wavelet representation. American Journal of Physical Anthropology, 128:608-622.
Lewy, Z. 2002. The function of the ammonite fluted septal margins. Journal of Paleontology, 76:63-69.
Lutz, T.M. and Boyajian, G.E. 1995. Fractal geometry of ammonoid sutures. Paleobiology, 21:329-342.
Manship, L.L. 2004. Pattern matching: classification of ammonitic sutures using GIS. Palaeontologia Electronica, 7.2.6A:15pp, 736KB; http://palaeo-electronica.org/paleo/2004_2/suture/issue2_04.htm
Olóriz, F. and Palmqvist, P. 1995. Sutural complexity and bathymetry in ammonites: fact or artifact? Lethaia, 28:167-170.
Olóriz, F., Palmqvist, P., and Pérez-Claros, J.A. 1997. Shell features, main colonized environments, and fractal analysis of sutures in Late Jurassic ammonites. Lethaia, 30:191-204.
Olóriz, F., Palmqvist, P., and Pérez-Claros, J.A. 2002. Morphostructural constraints and phylogenetic overprint on sutural frilling in Late Jurassic ammonites. Lethaia, 35:158-168.
Pérez-Claros, J.A. 2005. Allometric and fractal exponents indicate a connection between metabolism and complex septa in ammonites. Paleobiology, 31:221-232.
Pérez-Claros, J.A., Olóriz, F., and Palmqvist, P. 2007. Sutural complexity in Late Jurassic ammonites and its relationship with phragmocone size and shape: a multidimensional approach using fractal analysis. Lethaia, 40:253-272.
Pérez-Claros, J.A., Palmqvist, P., and Olóriz, F. 2002. First and second orders of suture complexity in ammonites: a new methodological approach using fractal analysis. Mathematical Geology, 34:323-343.
Rohlf, F.J.1990. Fitting curves to outlines, p. 167-177. In Rohlf, F.J. and Bookstein, F.L. (eds.), Proceedings of the Michigan Morphometrics Workshop. The University of Michigan Museum of Zoology, Ann Arbor.
Saunders, W.B. 1995. The ammonoid suture problem: relationship between shell- and septal thickness and suture complexity in Paleozoic ammonoids. Paleobiology, 21:343-355.
Saunders, W.B. and Work, D.M. 1996. Shell morphology and suture complexity in Upper Carboniferous ammonoids. Paleobiology, 22:189-218.
Saunders, W.B. and Work, D.M. 1997. Evolution of shell morphology and suture complexity in Paleozoic prolecanitids, the rootstock of Mesozoic ammonoids. Paleobiology, 23:301-325.
Saunders, W.B., Work, D.M., and Nikolaeva, S.V. 1999. Evolution of complexity in Paleozoic ammonoid sutures. Science, 286:760-763.
Seilacher, A. and LaBarbera, M. 1995. Ammonites as Cartesian divers. Palaios, 10:493-506.
Takemura, C.M., Cesar, R.M., Jr., Arantes, R.A.T., da Costa, L.F., Hingst-Zaher, E., Bonato, V., and dos Reis, S.F. 2004. Morphometrical data analysis using wavelets. Real-time Imaging, 10:239-250.
Ubukata, T. 2004. A three-dimensional digitizing system based on triangulation using multiple viewing images. Geoscience Reports of Shizuoka University, 31:65-72. (in Japanese with English abstract)
Ubukata, T. and Sugino, S. 2007. EATPAN: a computer software for coloring of crystal orientation by trend-plunge angles. Geoscience Reports of Shizuoka University, 35:55-63. (in Japanese with English abstract)
Ubukata, T., Tanabe, K., Shigeta, Y., Maeda, H., and Mapes, R. 2010. Eigenshape analysis of ammonoid sutures. Lethaia, 43:266-277.
Walker, J.S. 1999. A Primer on Wavelets and their Scientific Applications. Chapman & Hall/CRC Press, Boca Raton.
Ward, P.D. 1980. Comparative shell shape distributions in Jurassic-Cretaceous ammonites and Jurassic-Tertiary nautiloids. Paleobiology, 6:32-43.
Weitschat, W. and Bandel, K. 1991. Organic components in phragmocones of Boreal Triassic ammonoids: implications for ammonoid biology. Paläontologische Zeitschrift, 65:269-303.
Westermann, G.E.G. 1958. The significance of septa and sutures in Jurassic ammonite systematics. Geological Magazine, 95:441-455.
Westermann, G.E.G. 1971. Form, structure and function of shell and siphuncle in coiled Mesozoic ammonoids. Royal Ontario Museum, Life Sciences Contributions, 78:1-39.
Westermann, G.E.G. 1975. Model for origin, function and fabrication of fluted cephalopod septa. Paläontologische Zeitschrift, 49:235–253.
Yacobucci, M.M. and Manship, L.L. 2011. Ammonoid septal formation and suture asymmetry explored with a geographic information systems approach. Palaeontologia Electronica 14.1.3A:17pp;
palaeo-electronica.org/2011_1/136/index.html
