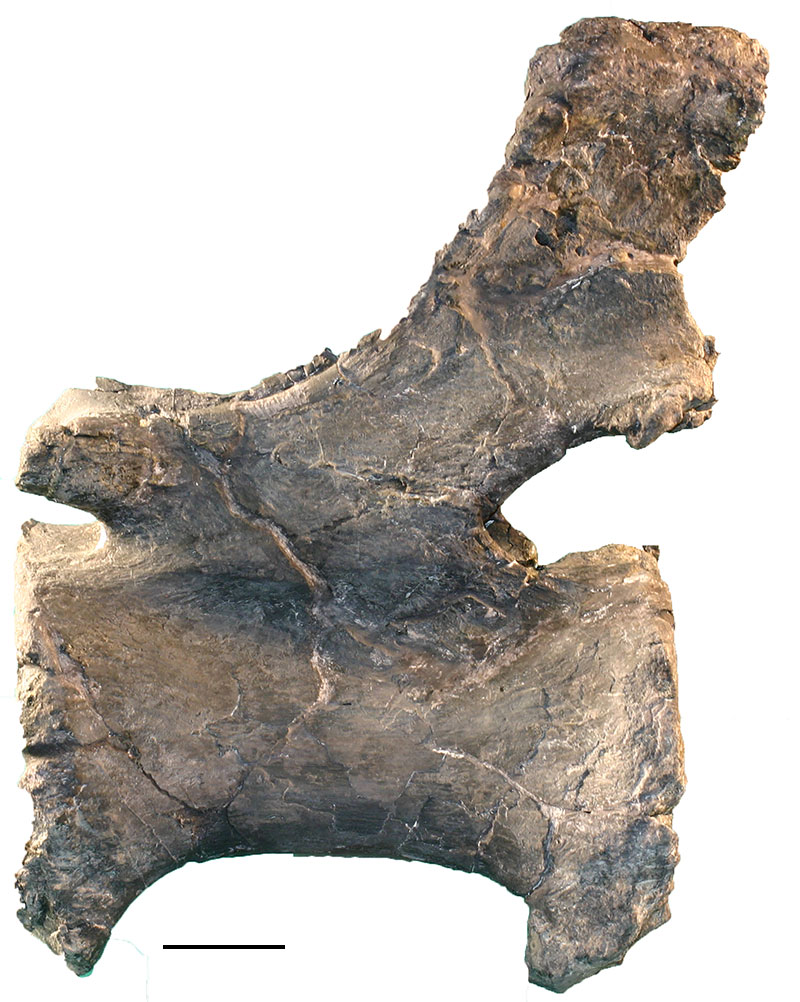
FIGURE 1. General location of the Aaron Scott Site in Emery County, Utah (modified from the US Census Bureau, 2000)
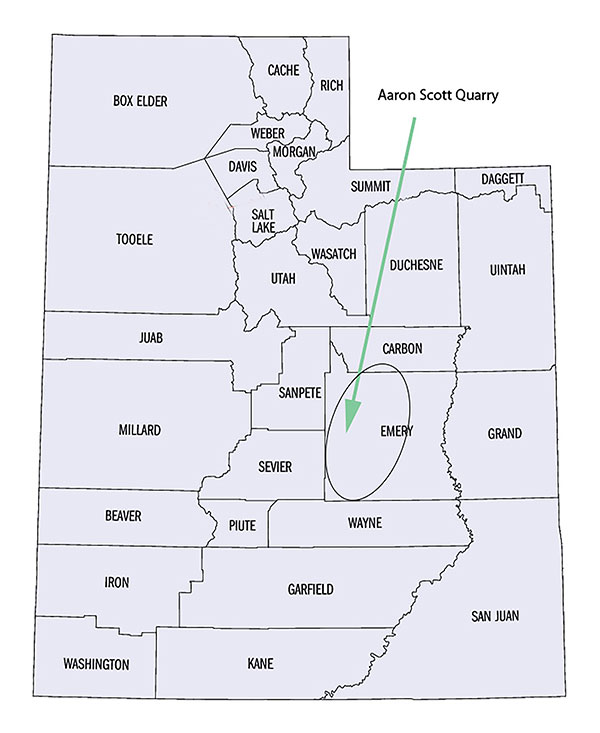
FIGURE 2. General stratigraphy of the Morrison Formation in the vicinity of the Aaron Scott Site.
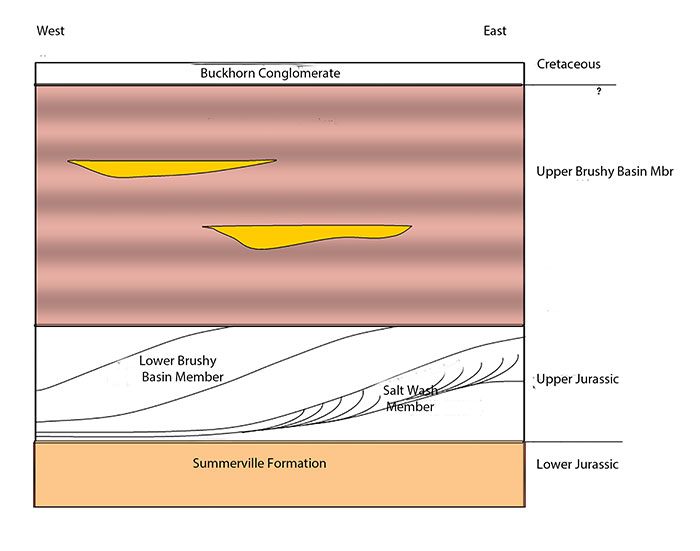
FIGURE 3. Sequence stratigraphy of the Aaron Scott Site, showing the position of the dinosaur bones and overlying Unio clams. Beds coarsen upward and measured sections tend to coarsen upward and westward as well. Erosional truncational surfaces are bold correlation lines while truncated and onlapping bedding are finer correlation lines.
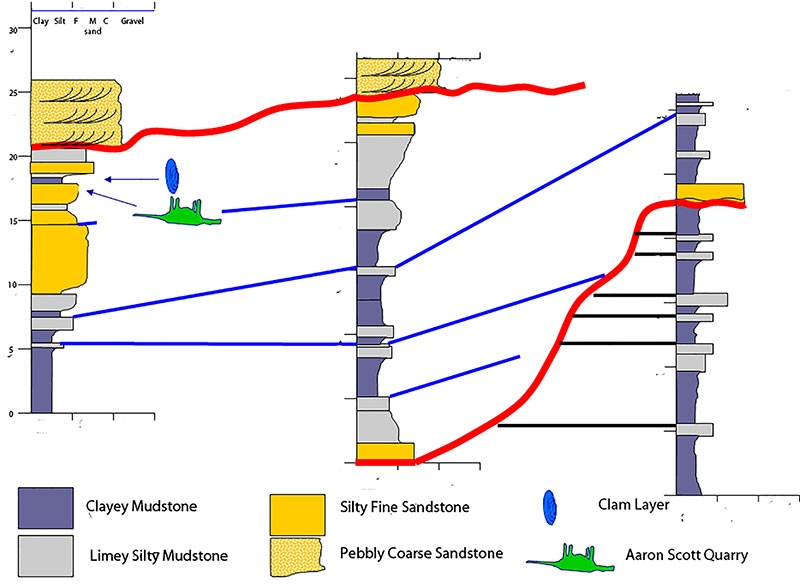
FIGURE 4. Reconstruction of a circum-lacustrine environment combined from Alberdi et al. (2001) and Mancuso and Marsicano (2008) showing the position of the six taphofacies: A) swampy environment with periodic fluvial influence; B) swampy/lacustrine environment; C) delta plain; D) delta front; E) prodelta; and F) offshore lacustrine. The Aaron Scott Quarry is at position D. (Adapted from Mancuso and Marsicano, 2008).
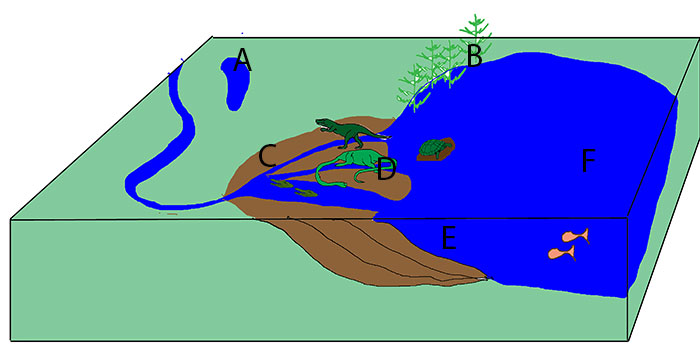
FIGURE 5. Stratigraphic view of the Aaron Scott Site showing the vertical distribution of the bones in the quarry. The diplodocid bones tend to be slightly higher stratigraphically than other bones in the quarry.
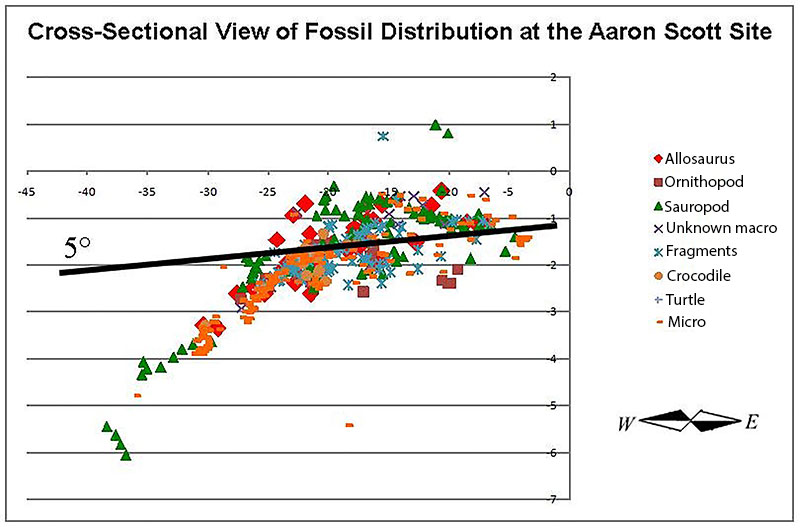
FIGURE 6. Quarry map of the Barosaurus associated skeleton of the Aaron Scott Site showing distribution of the bones collected 2005-2012 in map view.
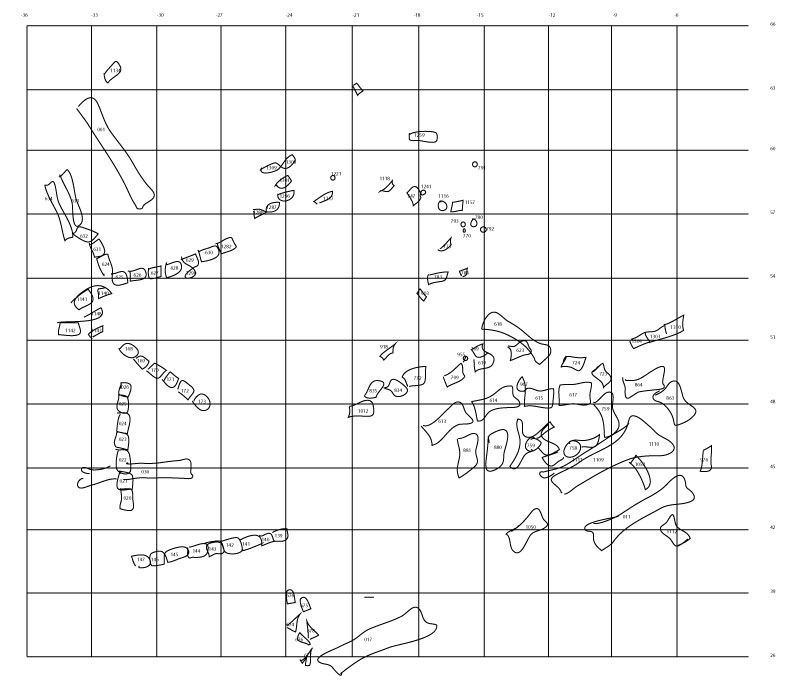
FIGURE 7. A distribution of the bones of the diplodocid based on FTI groups (Frison and Todd, 1986).
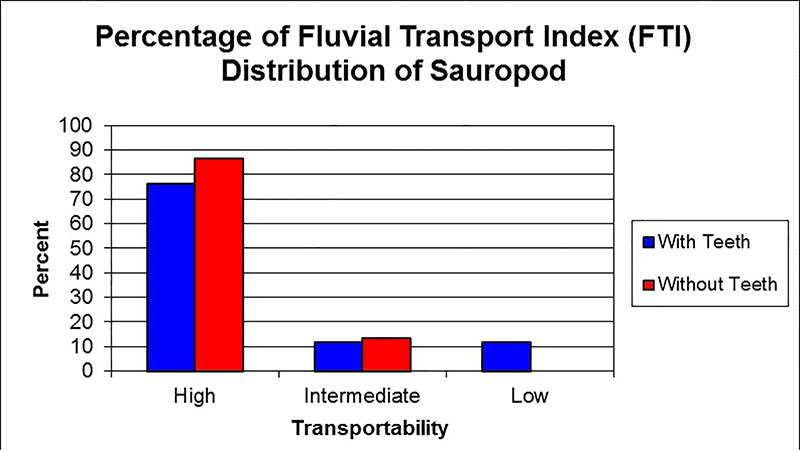
FIGURE 8. Rose diagram showing the orientation of the sauropod bones. A poor bimodal distribution is indicated, with one set of bones oriented to the west and a second set oriented northwest-southeast.
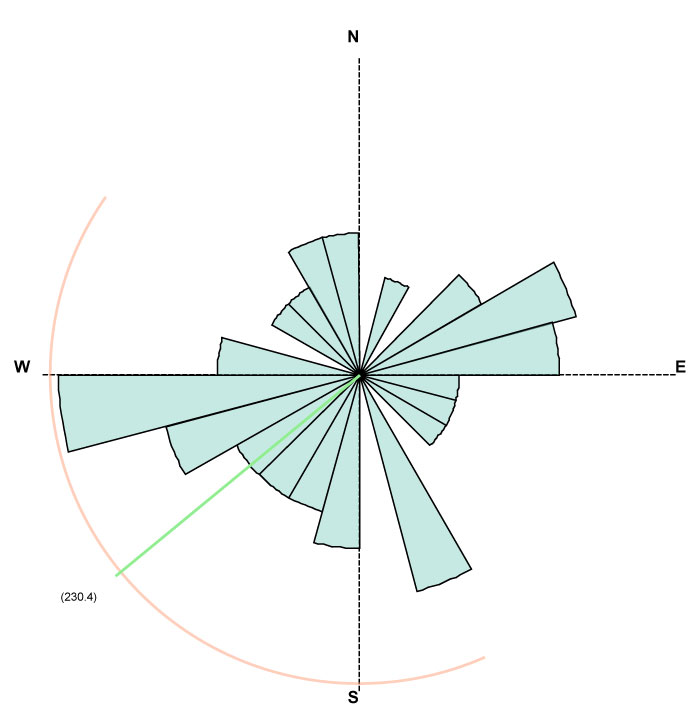
FIGURE 9. Ternary diagram showing the expected bones of a complete sauropod skeleton and the path of enrichment that bones would take if they were transported from their source compared to if they were enriched at the source. Bones of the sauropod indicate an enrichment in group 1 bones, suggesting a terminal transport deposition of the bones.
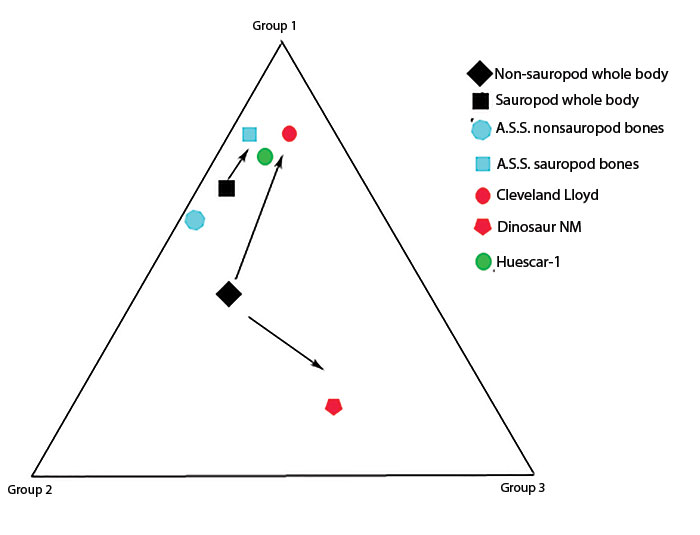
FIGURE 10. A distribution of the non-sauropod bones on Voorhie’s groups. The bones were plotted with and without the Allosaurus teeth because the abundance of Allosaurus teeth suggest that the Allosaurus was feeding on the sauropod and that the teeth were not transported into the area. Excluding the Allosaurus teeth, the bones show an enrichment of group 1 bones, suggesting a terminal transport deposition of these bones.
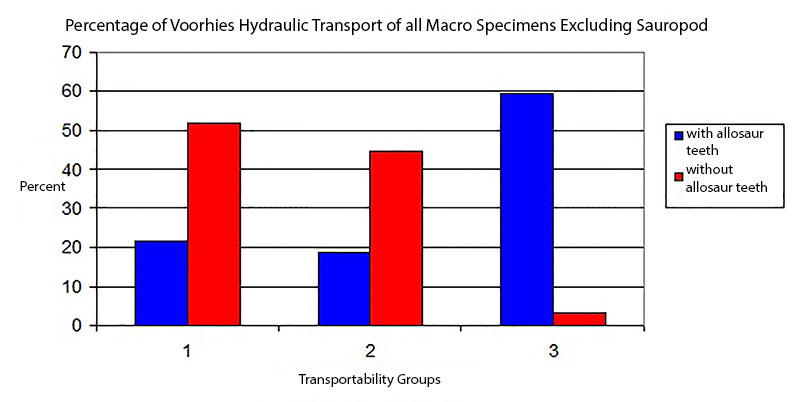
FIGURE 11. Rose diagram showing the orientation of the non-sauropod bones. The distribution of these bones shows very weak orientation, but does indicate a bimodal distribution with one set oriented to the west and a second set oriented northwest-southeast.
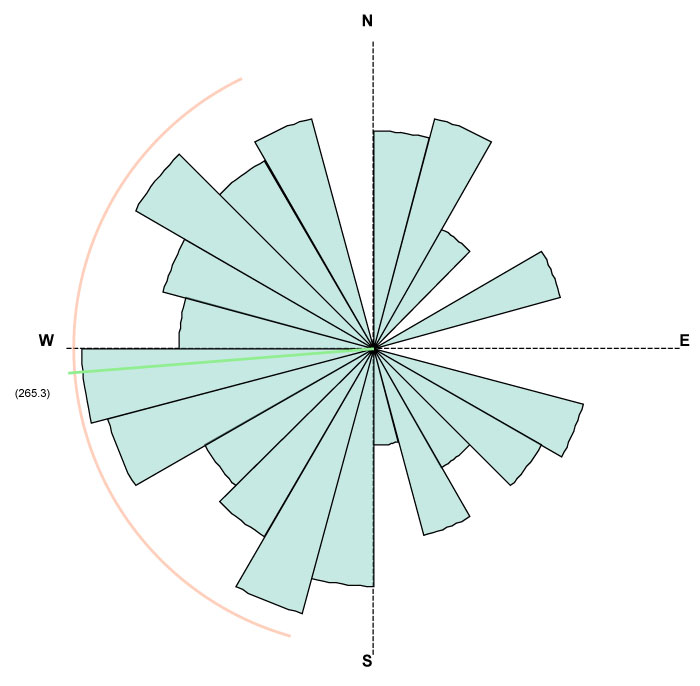
FIGURE 12. Histogram of bone weathering and abrasion for non-sauropod bones (sauropod bones had weathering of zero and are not included on this diagram). Weathering rank of 2 indicates flaking and cracking of the outer layer of the bone and is the most common in non-fragmented bones. Fragmented bones are ranked as a 5, indicating that the bones have broken apart and may have been rounded
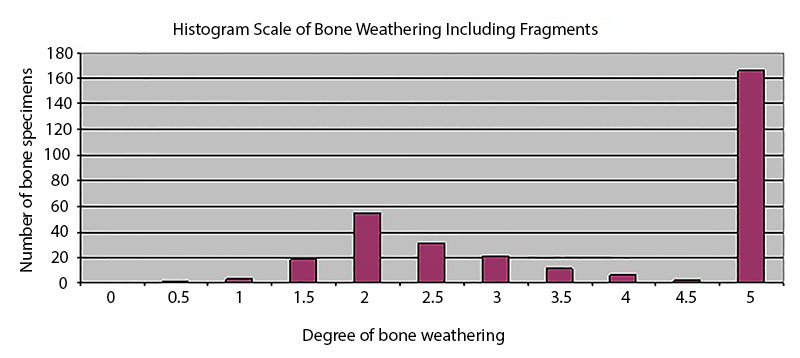
FIGURE 13. Examples of weathering stages of bones at the Aaron Scott Quarry. 13.1) Dryosaurus vertebra (VP 8612) with weathering stage 2. Note that the neural arch was broken prior to burial. Scale bar equals 5 cm.
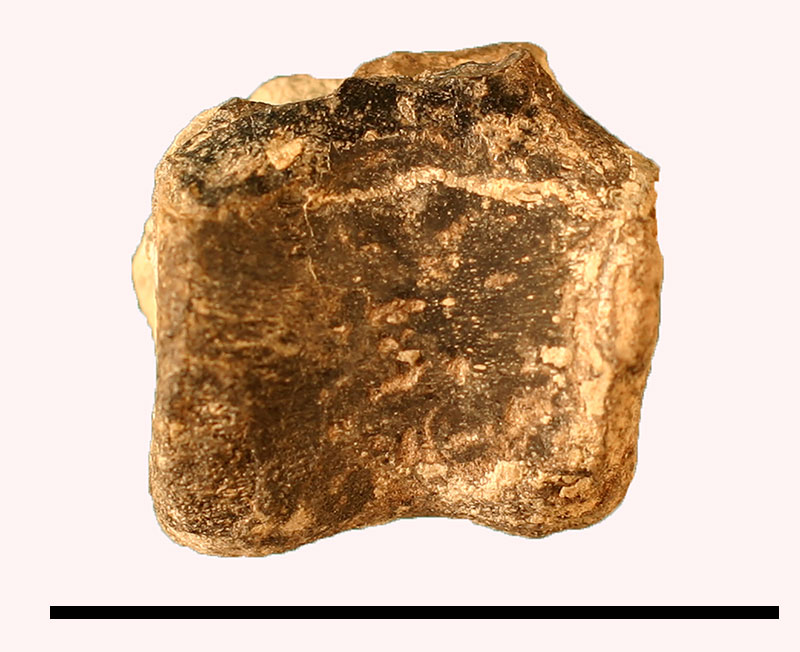
FIGURE 14. Fragments of bones (VP 8958) with weathering stage 5. Scale bar equals 5 cm.
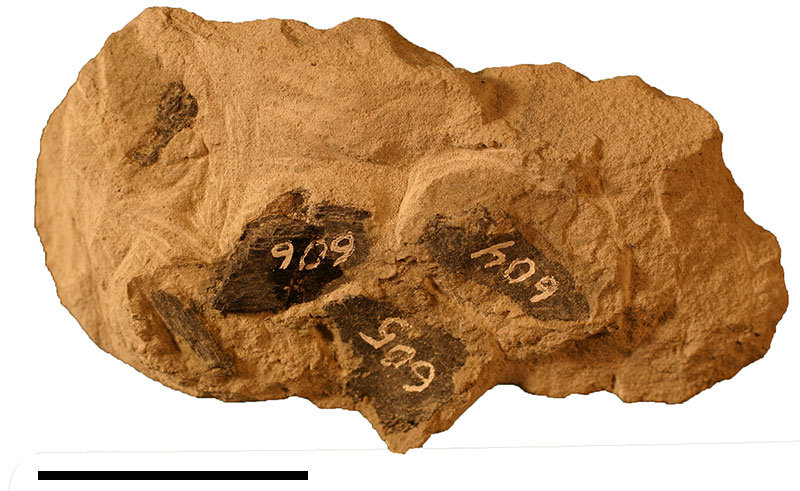
FIGURE 15. Allosaurus metatarsal (VP 8628) with weathering stage 0. Scale bar equals 5cm.
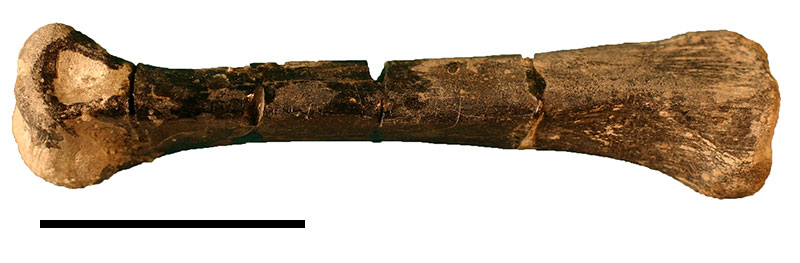
FIGURE 16. Barosaurus caudal vertebra (A. S. S. 772) with weathering stage 0. Scale bar equals 5 cm.