FIGURE 1. Cross sections of the microCT images of the analyzed hominin MC1s.
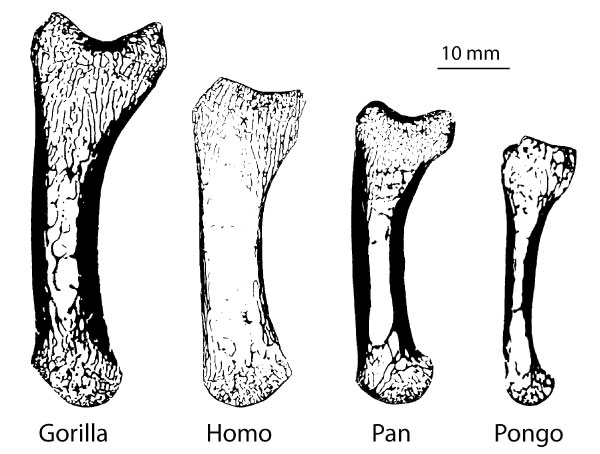
FIGURE 2. Using different morphological filters, the original microCT data (3) is separated into the cortical area (2) and trabecular area (4). Cortical thickness (1) is analyzed using the methods of Hildebrand and Rüegsegger (1997) and depicted here by a colour map. The morphological analyses (5) compute the bone volume fraction (BV/TV; colour map) and trabecular orientation (i.e., fabric tensor; white lines) in volume of interests throughout the bone.
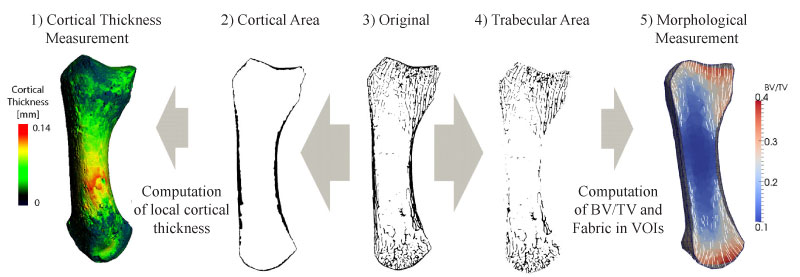
FIGURE 3. The cortical images and the trabecular bone meshes are split into the anatomical base, shaft and head regions. The mean cortical thickness and BV/TV are computed for all three regions, while trabecular thickness, degree of anisotropy and trabecular orientation are typically computed in the head and base regions only.
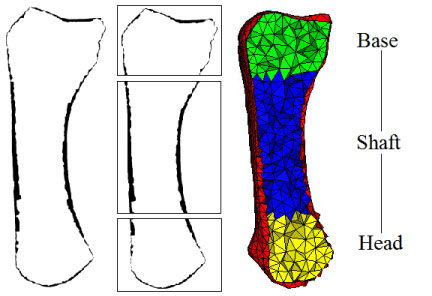
FIGURE 4. Background grid with a grid distance of 2.5 mm applied to the proximal head of the first metacarpal. The local BV/TV and fabric values of the grid points are computed inside the volume defined by the sampling sphere (5 mm diameter).
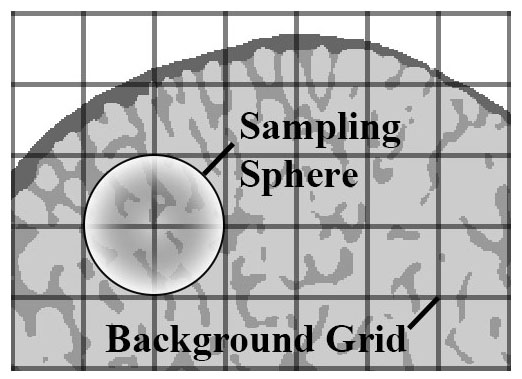
FIGURE 5. Example of the effect of different closing kernel (kC) sizes on the extracted cortical area in the Homo metacarpal. (1) A 3D model of the bone and cutting plane; (2) the segmented cross-section, (3) representation of different kernel sizes in a close-up view; (4-6) results of the extraction of the cortical area using different kernel sizes. Highlighted areas show the major differences between the various kernels used for extraction (green, cortical thickness is the same; red, cortical thickness is different). In black are bone voxels included in the extracted cortex and in grey are the original bone voxels not included in the cortex.
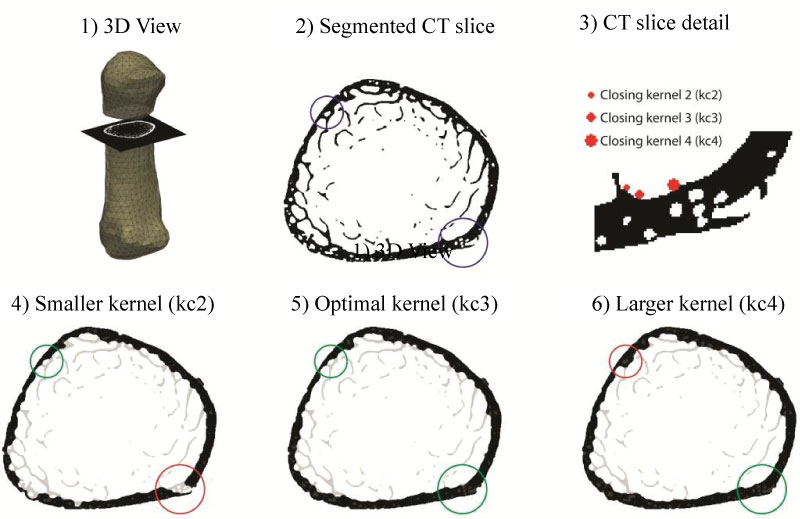
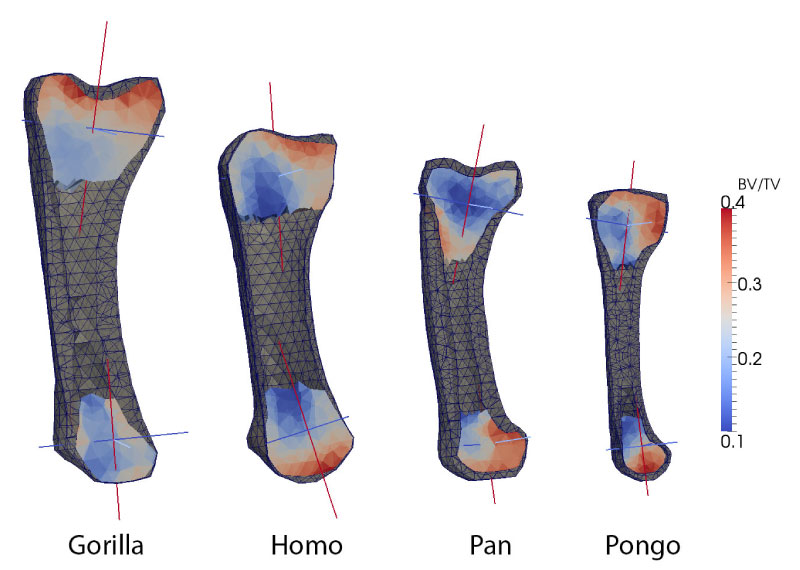
FIGURE 6. Bone volume fraction (BV/TV) and trabecular orientation for each metacarpal. BV/TV is depicted as colour map throughout the head and base regions. The red axes denote the directions of the major trabecular orientation, dark blue axes denote the directions of the minor trabecular orientation. The α and β define the angles between the major trabecular orientation and the proximodistal axes in the dorsopalmar plane for the base and the head region.