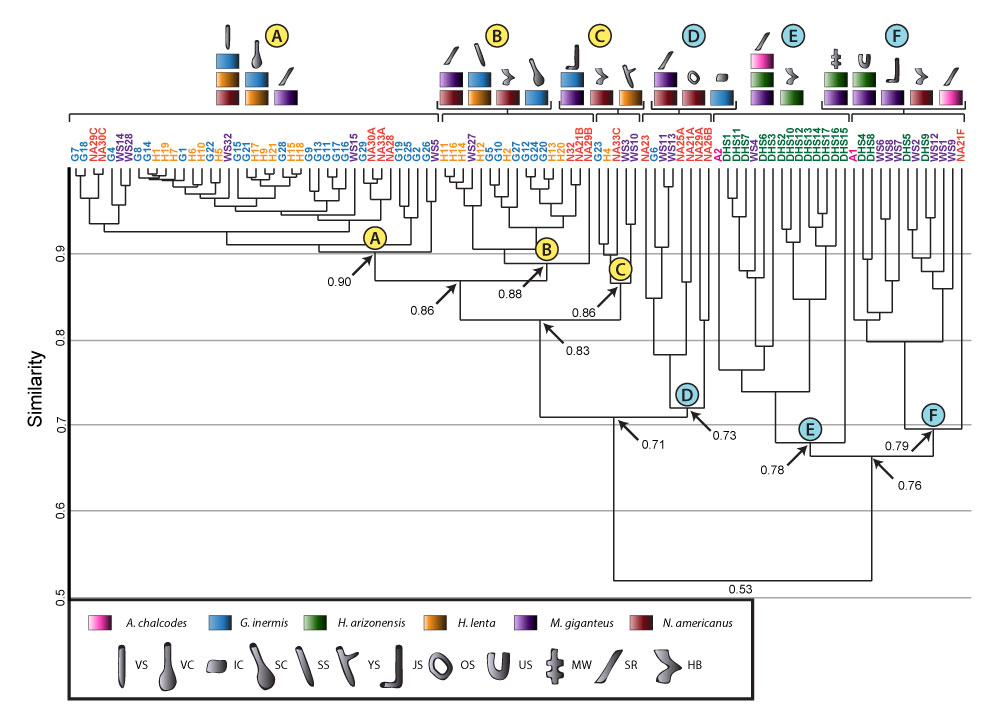
FIGURE 1. Basic spider morphology. Modified from Dipenaar-Schoeman (2002).
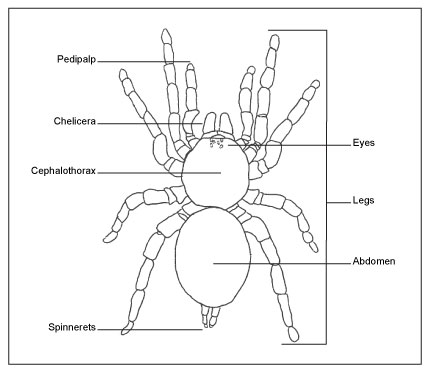
FIGURE 2. Representatives of spiders used in this study. 1, Adult Gorgyrella inermis. 2, Juvenile G. inermis. 3, Hogna lenta.
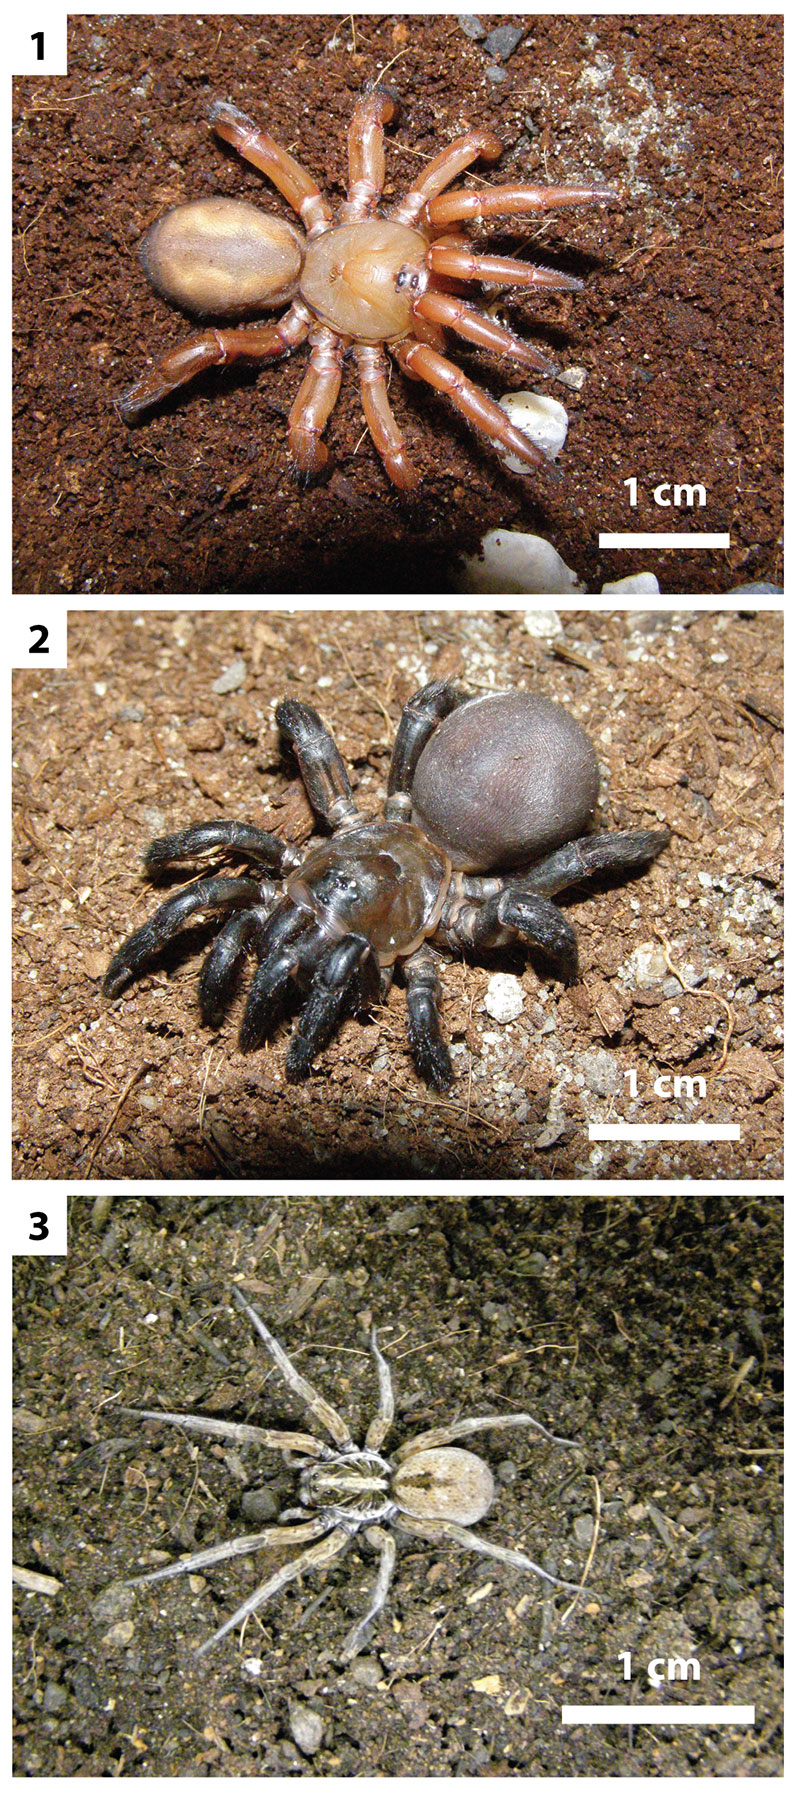
FIGURE 3. Quantitative properties of burrows. 1, Measurements of burrows included maximum depth (D), slope (OA), total length (L), branching angle (BA), and tunnel and shaft width (w), height (h), and circumference (c). Width is defined as parallel to the hinge-line of the burrow trapdoor; height is defined as perpendicular to the hinge-line of the burrow trapdoor. 2, Complexity (C) is the sum of the number of segments (s), chambers (h), and surface openings (e) of a single burrow system. 3, Tortuosity is a measure of the average sinuosity of all of the segments of a burrow system. The tortuosity of a single segment is found by dividing the total length (u) by the straight-line distance (v). Modified from Hembree et al., 2012.
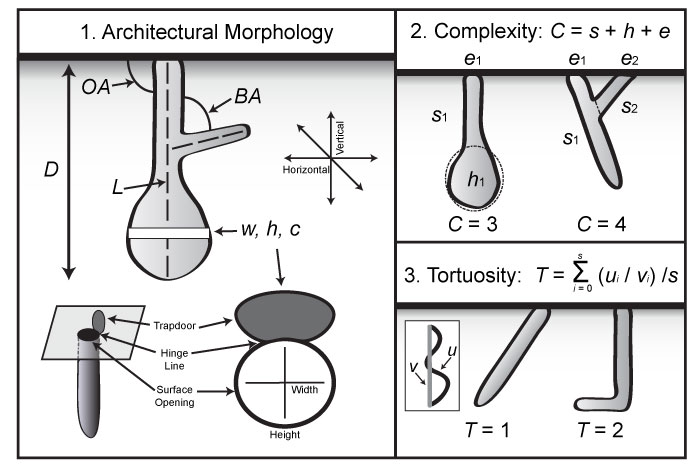
FIGURE 4. Representatives of other laboratory animals used for burrow comparisons. 1, A female Mexican blond tarantula (Aphonopelma chalcodes), 2, An Arizona hairy desert scorpion (Hadrurus arizonensis), 3, A whip scorpion (Mastigoproctus giganteus), 4, A giant American millipede (Narceus americanus).
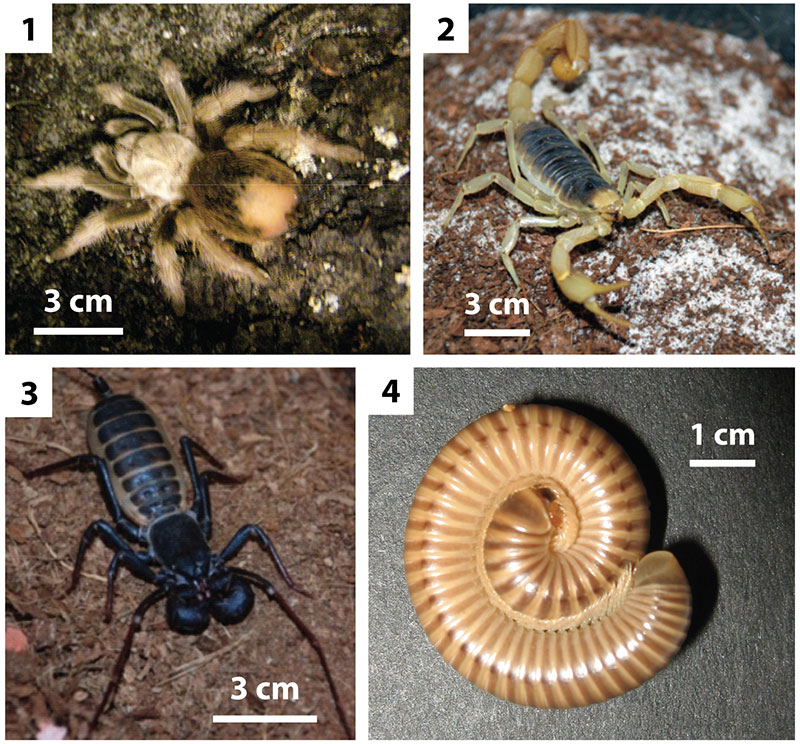
FIGURE 5. Burrow production by Hogna lenta. 1-2, Spider pushes headfirst into the sediment until it is nearly covered. 3, Spider turns around inside the chamber to face outward. 4, Spider applies silk to the sediment and moves it around. 5, Spider covers itself in silk-lined sediment. 6, Spinnerets gathering sediment together to form a trapdoor. The sediment surrounding the spider and its burrow has been lightened.
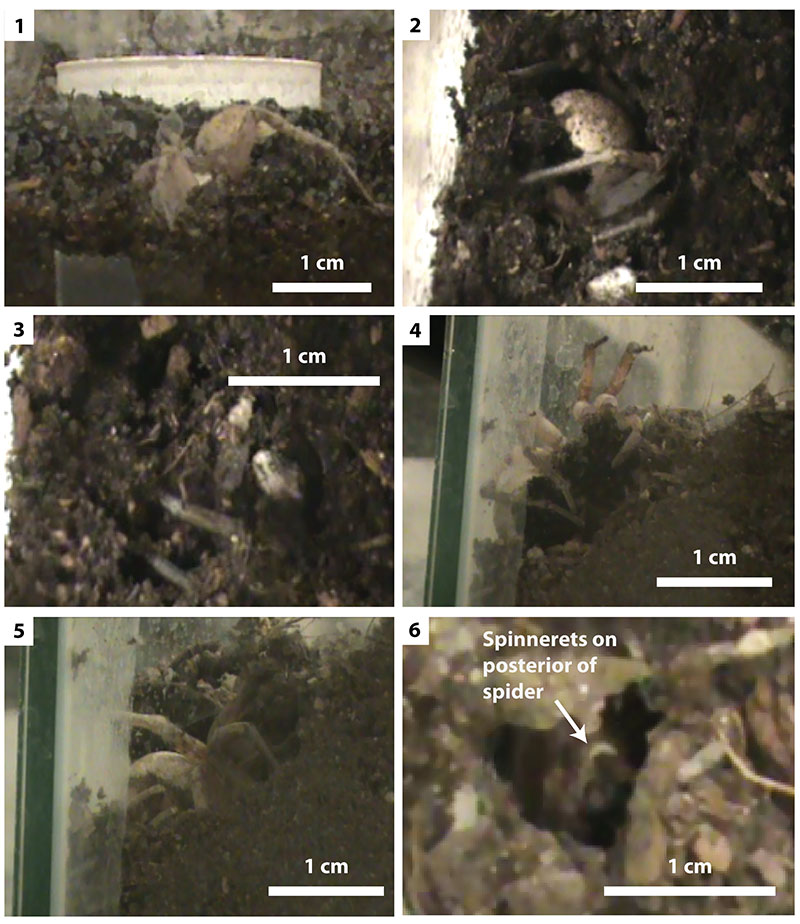
FIGURE 6. Brooding behavior of Hogna lenta. 1, An egg sac. 2, H. lenta with offspring. 3, A vertical shaft (H5) that served as a brood burrow.
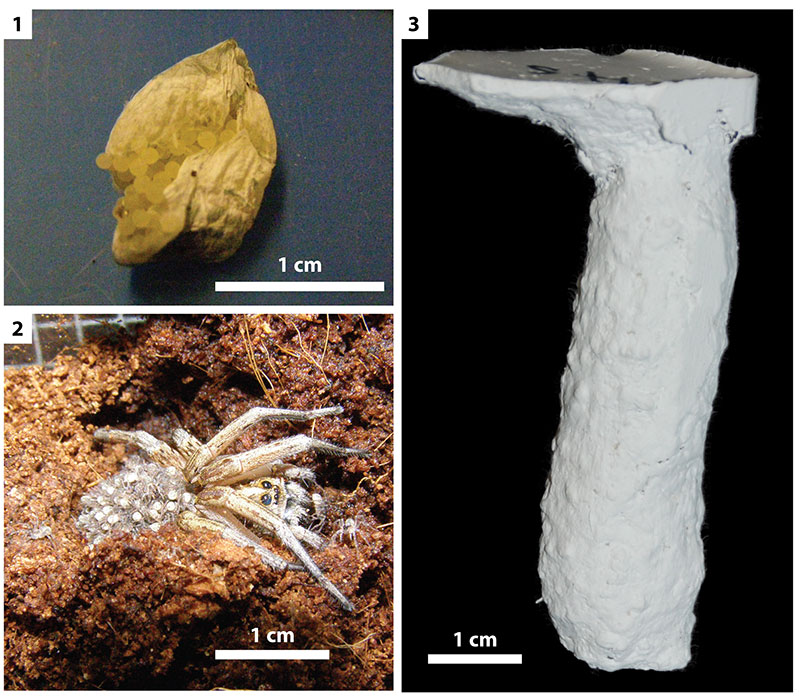
FIGURE 7. Burrow production by Gorgyrella inermis. 1, Spider excavates a small depression in the sediment. 2, Spider deposits silk in sediment at the base of the burrow, 3-4, Spider turns around inside of burrow and picks up bundles of sediment. 5, The spider throws the sediment from the burrow. 6, Spider deposits silk along the burrow wall.
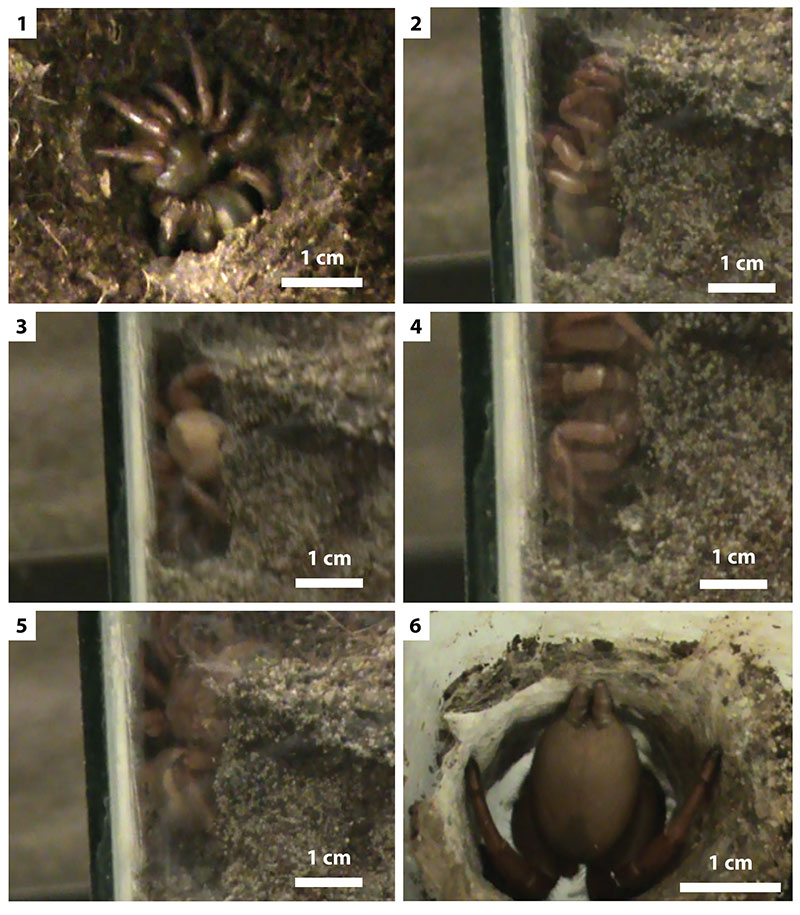
FIGURE 8. Surface features produced by Gorgyrella inermis. 1, Sediment forcefully removed from the burrow by the spider throwing packets with its chelicerae. 2, Trapdoor held open at a burrow entrance. 3, A silk mat produced by a spider that did not construct a burrow. 4, A cocoon built by a spider that did not burrow. The cocoon did not extend into the sediment.
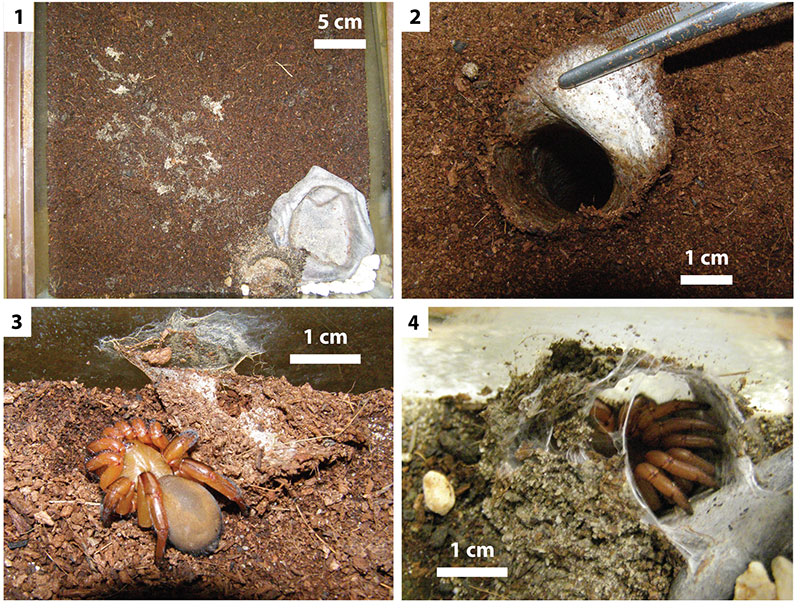
FIGURE 9. Surface features produced by Hogna lenta. 1, Open trapdoor at the burrow entrance. 2, Turret produced by building a burrow entrance against the sides of the terrarium. 3, Silk strands deposited along the sides of the terrarium.
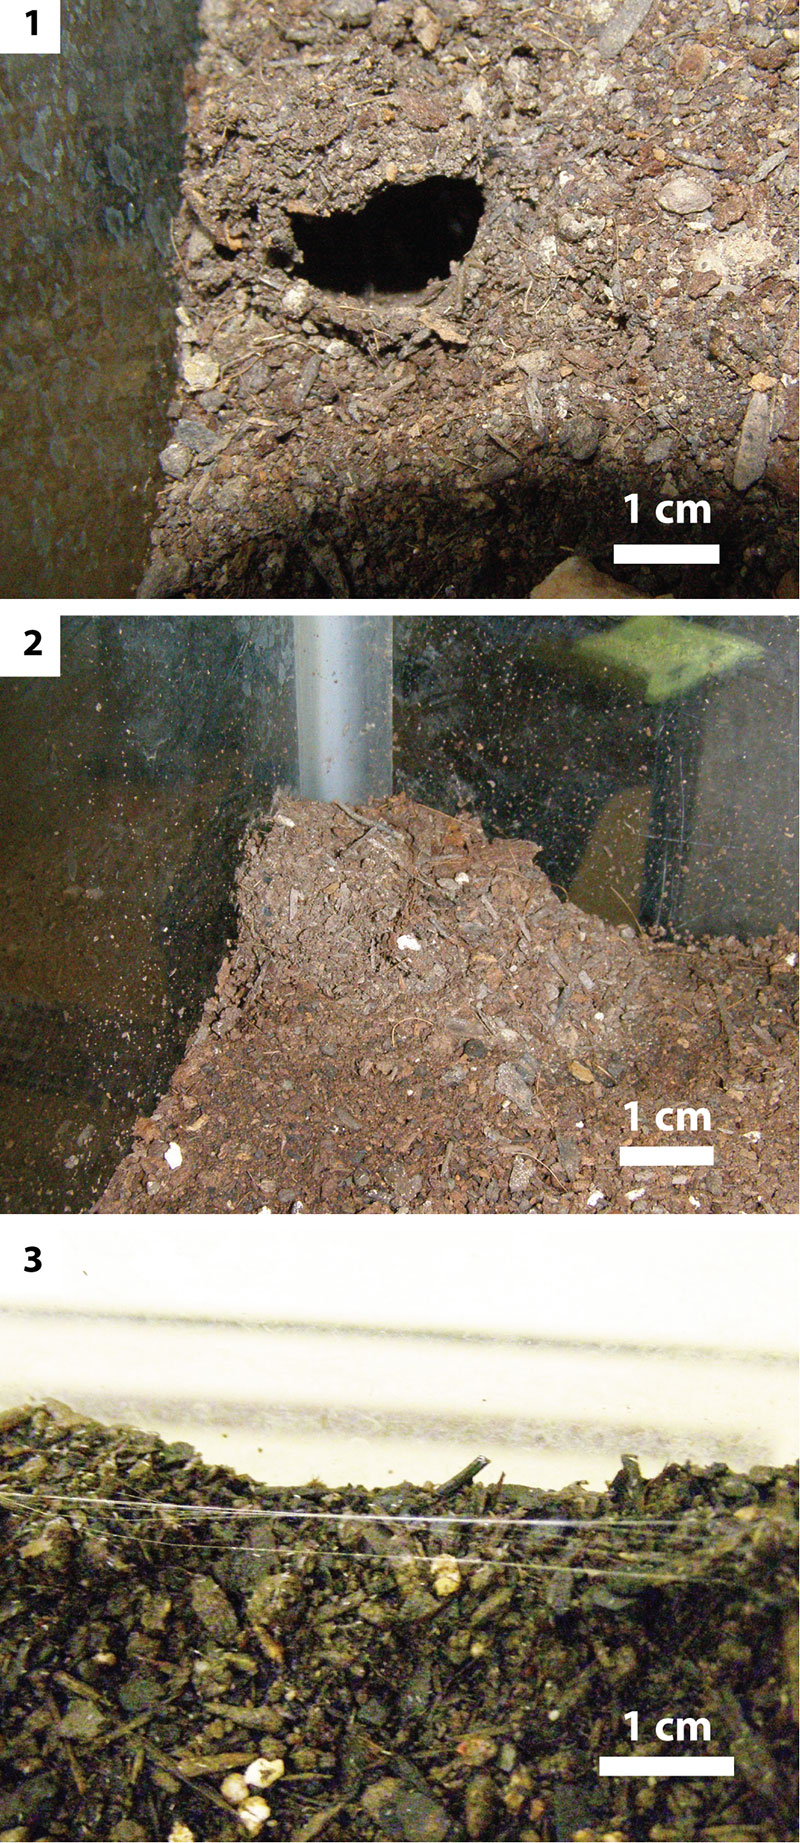
FIGURE 10. Striations on sides of burrow casts resulting from scratch marks in the silk linings of spider burrows. 1, Burrow produced by juvenile Gorgyrella inermis. 2, Burrow produced by adult G. inermis. 3-4, Burrows produced by Hogna lenta. The surfaces of H. lenta burrow casts include sediment, resulting from the thin layer of silk that lined these burrows.
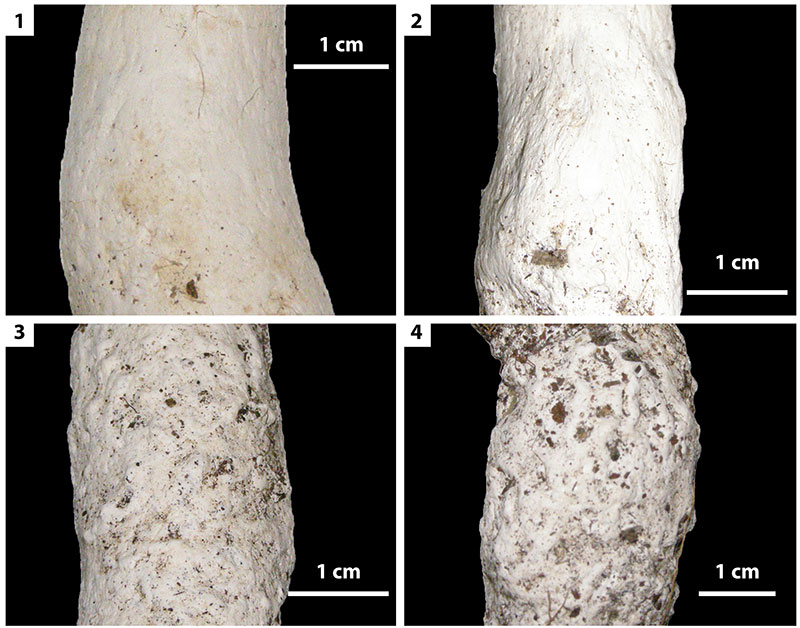
FIGURE 11. Changes in surficial features due to increasing stability of sediment. The spiders used less silk as sediment becomes more stable. This resulted in burrow casts with rougher sides than those with more silk. The first burrow was constructed in sediment composed of 50% silt-clay and had a thick silk lining. The third burrow was constructed in 100% silt-clay and had almost no silk lining.
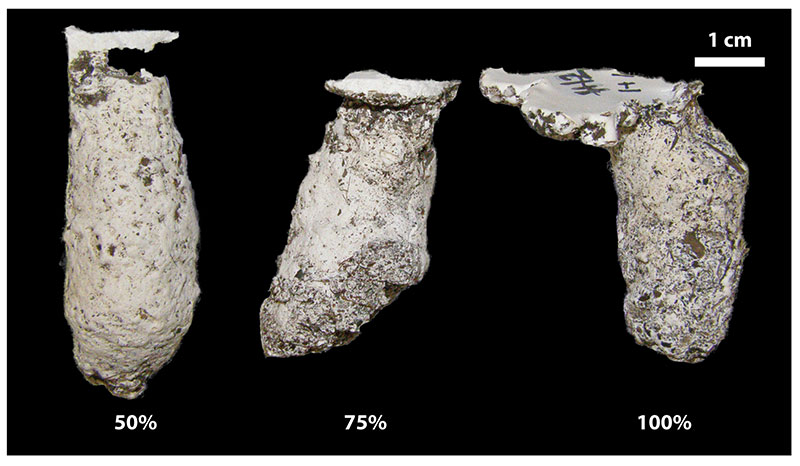
FIGURE 12. Vertical shafts. 1, Burrow produced by an adult Gorgyrella inermis (G9). 2, Burrow produced by Hogna lenta. This burrow served as a brood burrow in addition to a dwelling structure (H5). 3, Burrow produced by juvenile G. inermis (G15). 4, Burrow produced by H. lenta (H7).
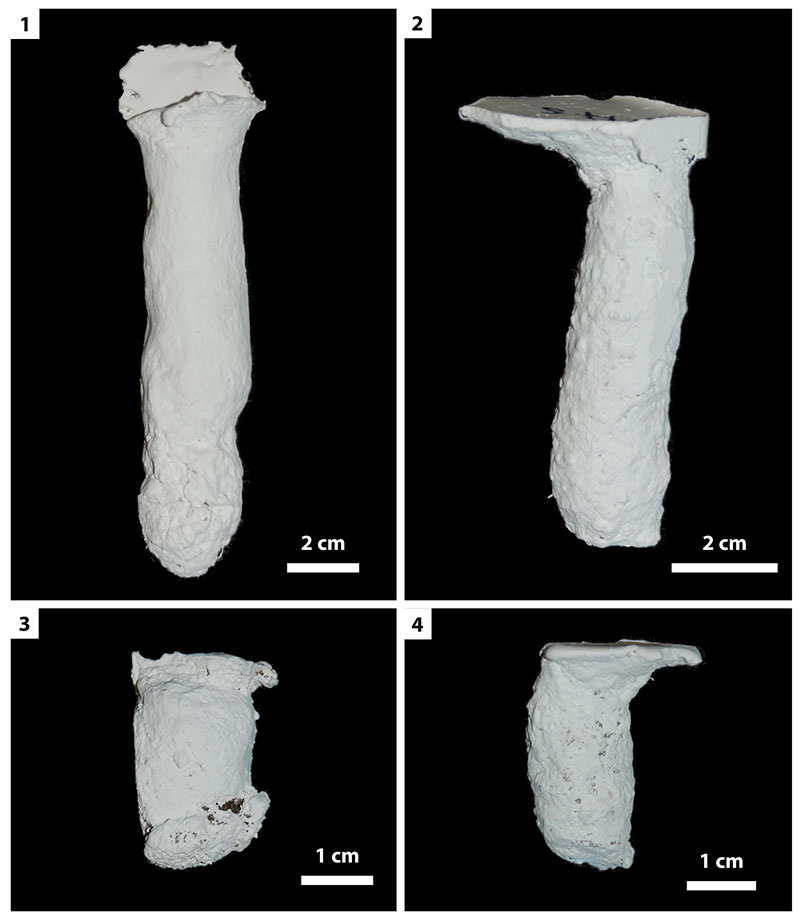
FIGURE 13. Subvertical shafts. 1, Burrow produced by adult Gorgyrella inermis (G24). 2, Burrow produced by adult G. inermis (G5). 3, Burrow produced by Hogna lenta (H14). 4, Burrow produced by H. lenta (H16).
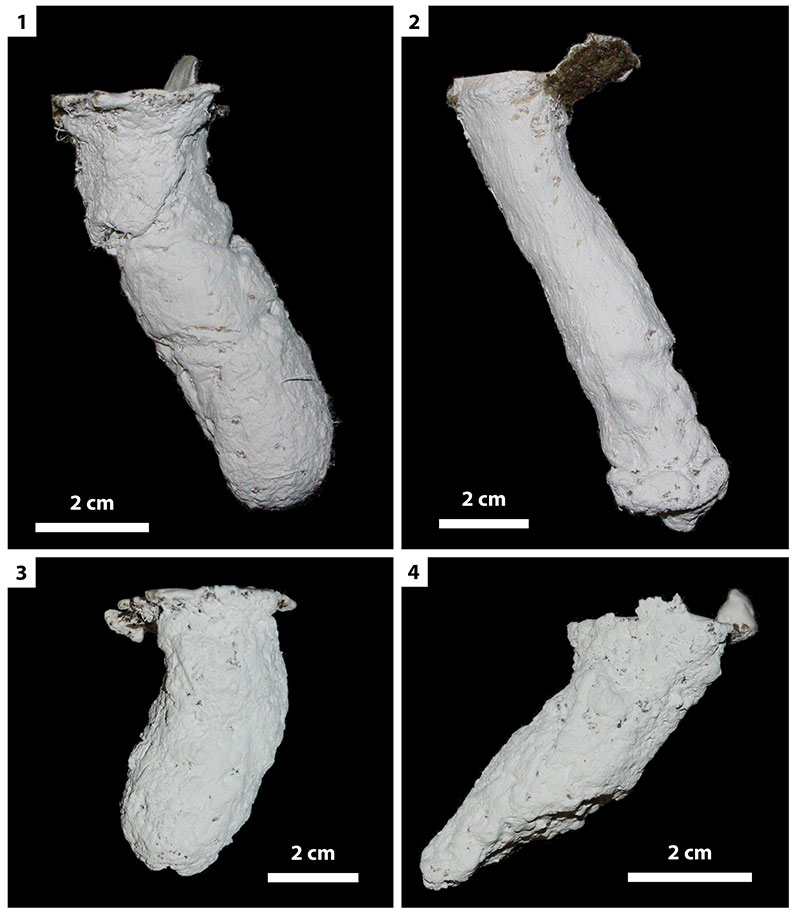
FIGURE 14. Vertical shafts with terminal chambers. 1, Burrow produced by juvenile Gorgyrella inermis (G2). 2, Burrow produced by adult G. inermis (G17). 3, Burrow produced by adult G. inermis (G16). 4, Burrow produced by Hogna lenta (H4).
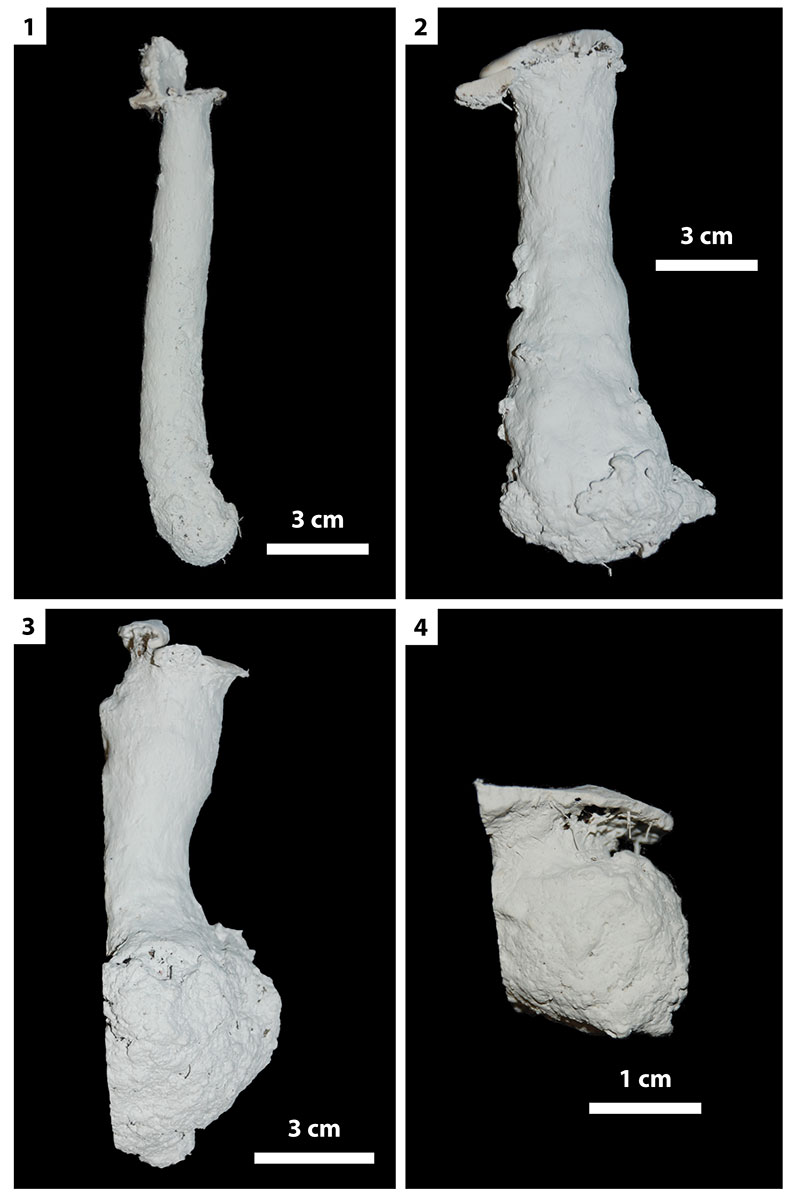
FIGURE 15. Other burrow architectures. 1, Y-shaped burrow produced by Hogna lenta (H4). 2, Isolated chamber produced by adult Gorgyrella inermis (G6). 3, Subvertical shaft with terminal chamber produced by adult G. inermis (G27). 4, J-shaped burrow produced by juvenile G. inermis (G23).
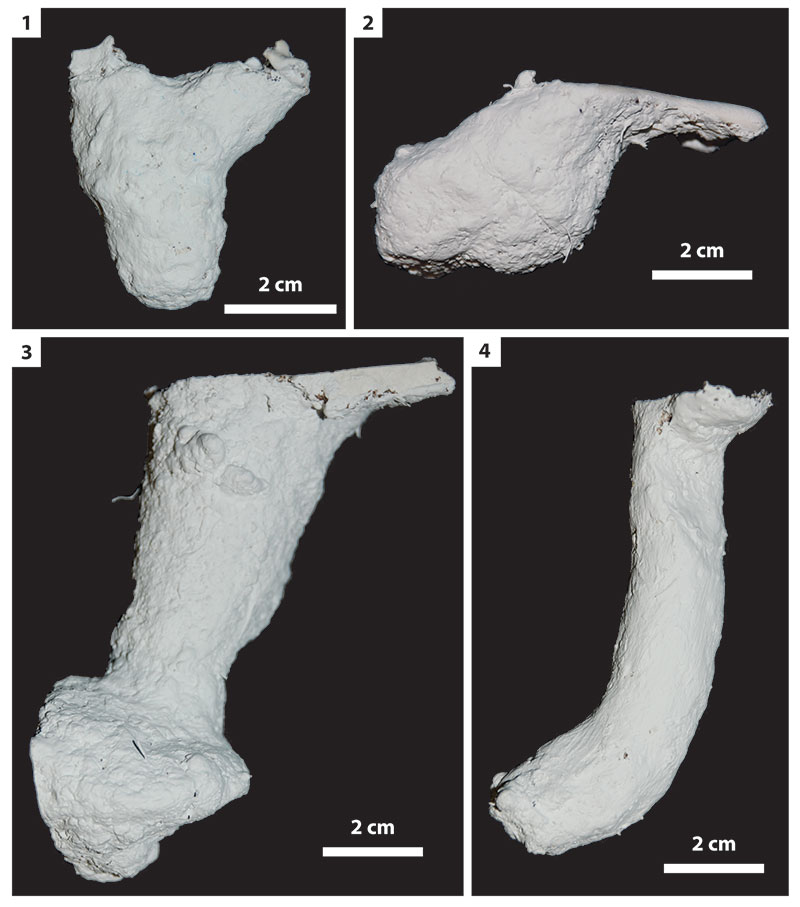
FIGURE 16. Cluster analysis of all burrows produced by Gorgyrella inermis in the study. Cluster A contains burrows with a vertical component. Cluster B contains burrows with a subvertical component and two burrows with vertical components. Values located at the nodes of the dendrogram are the mean Bray-Curtis similarity score of all burrows emanating from that node cluster. Brackets above the dendrogram group together main clusters and provide the mean Bray-Curtis similarity score of the burrows in that cluster. Clusters indicated by letters in yellow circles are clusters of spider burrows that form in all analyses. Burrow architecture is indicated in the key at the bottom of the figure; see Table 1 for key. Tracemaker is indicated by the color of the box with the associated name.
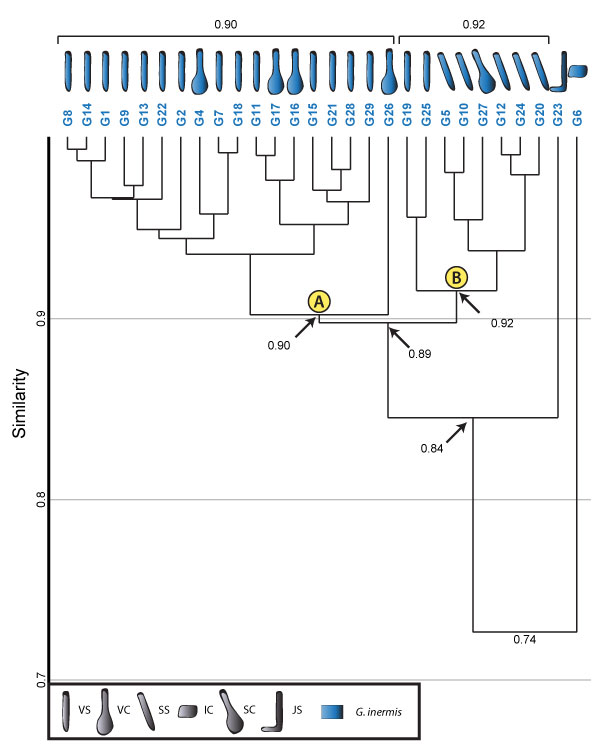
FIGURE 17. Cluster analysis of all burrows produced by Hogna lenta in the study. Cluster A consists mainly of burrows with a vertical component. Cluster B consists of burrows with a subvertical component. Formatting is the same as in Figure 16.
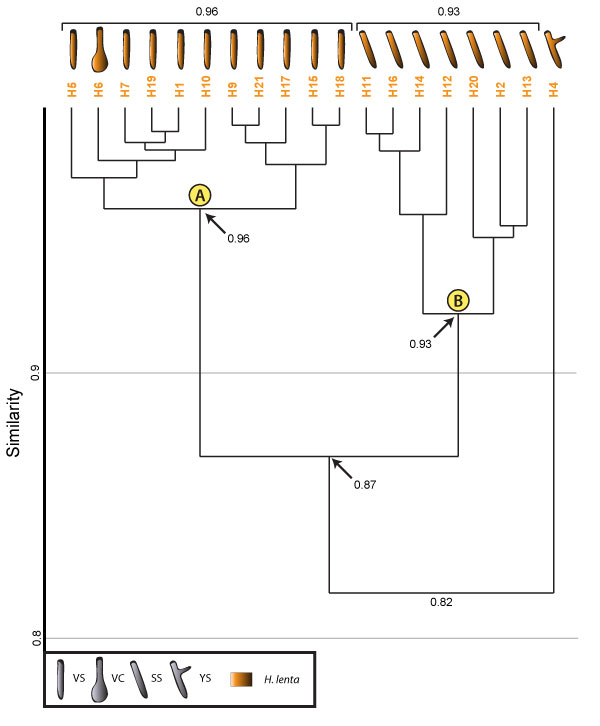
FIGURE 18. Cluster analysis of all burrows produced by Gorgyrella inermis and Hogna lenta. Clusters A (vertical) and B (subvertical) are maintained, but an additional cluster, C, forms. Cluster C contains the J- and Y-shaped burrows. The isolated chamber is not included in any cluster. Formatting is the same as in Figure 16.
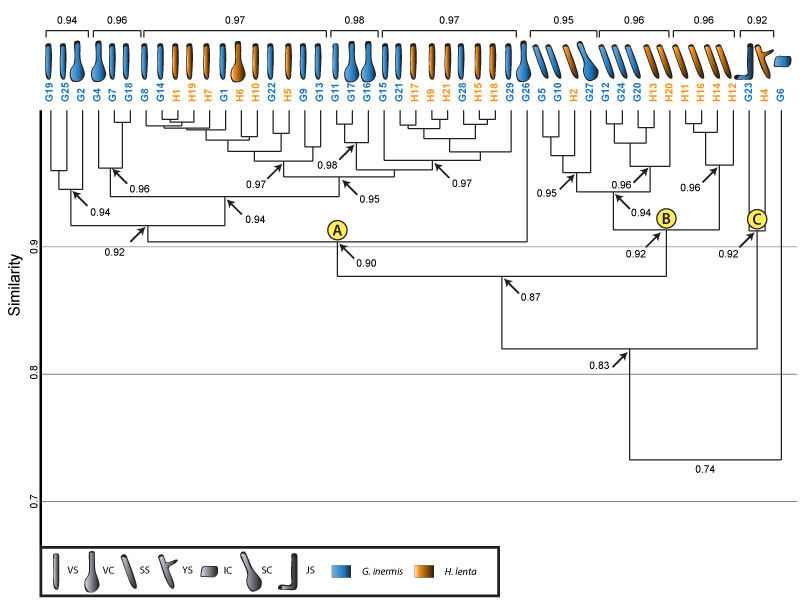
FIGURE 19. Combination of Bray-Curtis matrix and cluster analysis to explain how the cluster analysis groups burrow into the dendrogram. The burrows in the matrix were rearranged into the order (from left to right) produced by the dendrogram. Clusters, numbered 1-9, were matched with groupings in the matrix. The groupings in the matrix are highlighted with a white box. This box contains all of the similarity values contained within that cluster. All similarity values within a grouping are either 1.0 (identical) or 0.9 (highly similar). The separation between Clusters A and B is seen between grouping 5 and grouping 6. The cells above and the cells to the left of grouping 5 (similarity scores contained in Cluster A) have similarity values of 1.0 and 0.9, whereas cells below and cells to the right of grouping 5 (similarity scores contained in Cluster B) have similarity values of 0.9 and 0.8. The small range of similarity scores (1.0-0.8) when comparing both clusters explains why the node containing both clusters has a similarity score of 0.87. See Table 1 for architecture key.
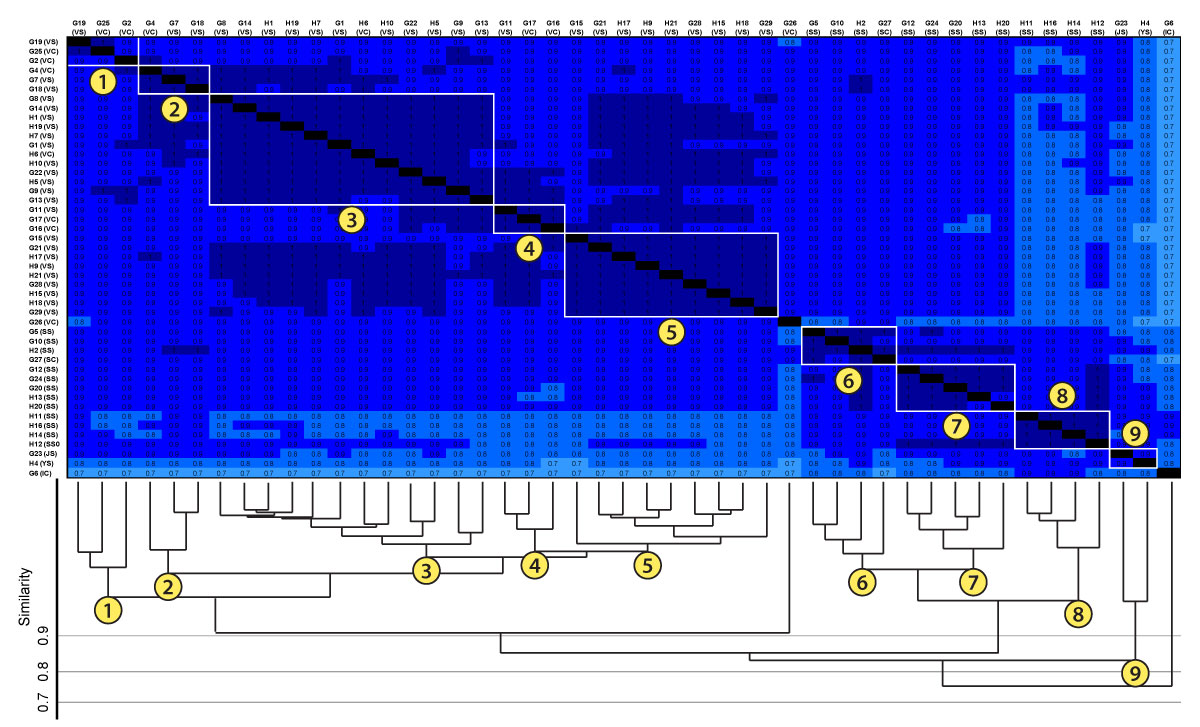
FIGURE 20. Cluster analysis of burrows produced by Aphonopelma chalcodes, Gorgyrella inermis , and Hogna lenta. Clusters A, B, and C are maintained, and the burrows G6 and A2 form a new cluster. The larger A. chalcodes burrow, A1, does not fall into a cluster. Formatting is the same as in Figure 16. Clusters indicated by letters in blue circles form only in this analysis. The subvertical ramp (SR) is an architecture unique to A. chalcodes.
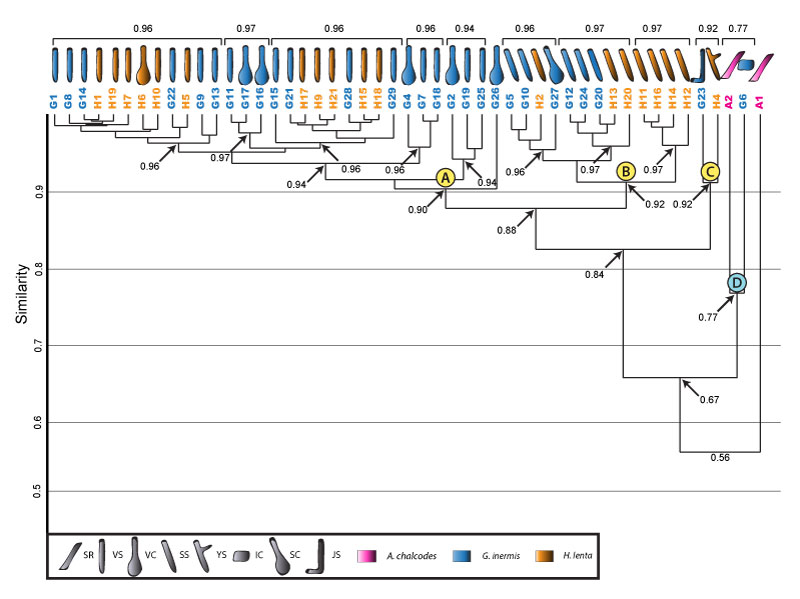
FIGURE 21. Cluster analysis of burrows produced by Hadrurus arizonensis, Gorgyrella inermis, and Hogna lenta. Spider Clusters A, B, and C are maintained, and a separate scorpion cluster is produced. Formatting and key is the same as in Figures 16 and 21. Mazeworks (MW), U-shaped burrows (US), subvertical ramps (SR), and helical burrows (HB) are produced H. arizonensis.
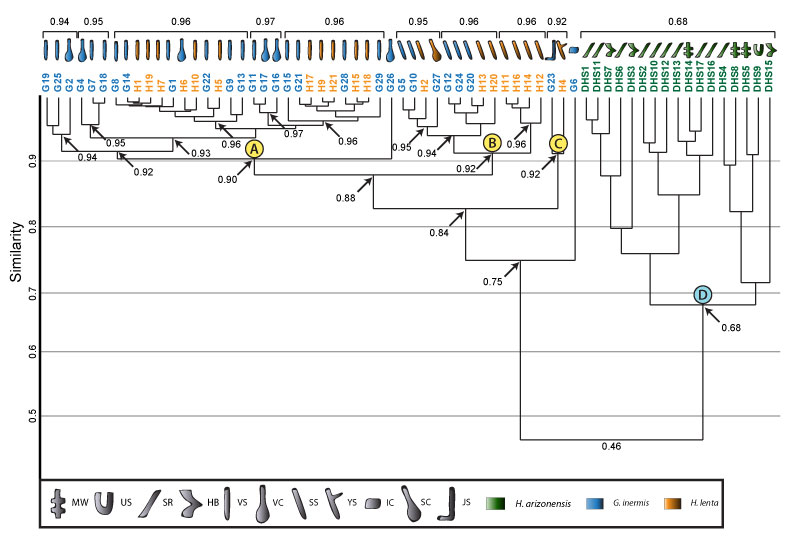
FIGURE 22. Cluster analysis of burrows produced by Mastigoproctus giganteus, Gorgyrella inermis, and Hogna lenta. Spider Clusters A, B, and C are maintained with the addition of morphologically similar whip scorpion burrows, and G6 forms a new cluster. Unique burrow architectures produced by M. giganteus form a separate cluster. Formatting and key is the same as in Figures 16 and 21. Mazeworks (MW), U-shaped burrows (US), and subvertical ramps (SR) are produced only by M. giganteus.
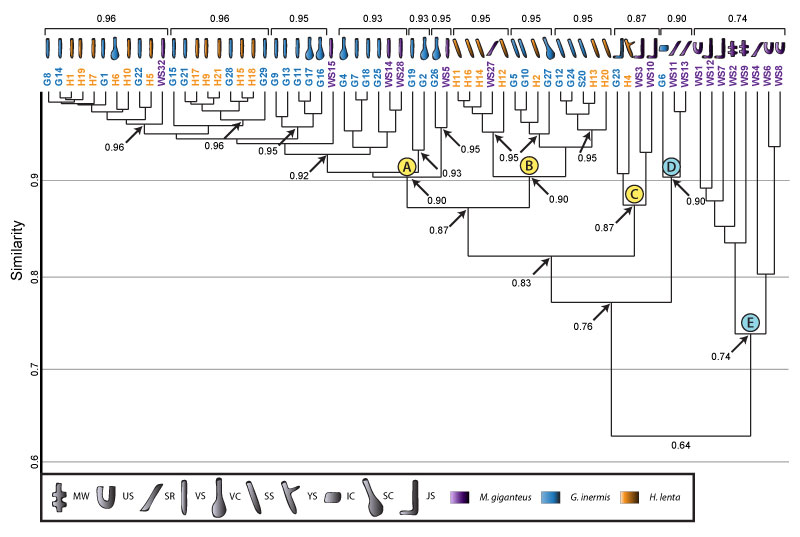
FIGURE 23. Cluster analysis of burrows produced by Narceus americanus, Gorgyrella inermis, and Hogna lenta. Spider Clusters A, B, and C are maintained and include burrows produced by all three species. G6 forms a new cluster with the most dissimilar burrows produced by N. americanus. Formatting and key is the same as in Figures 16 and 21. O-shaped burrows (OS), U-shaped burrows (US), and subvertical ramps (SR) are only produced by N. americanus.
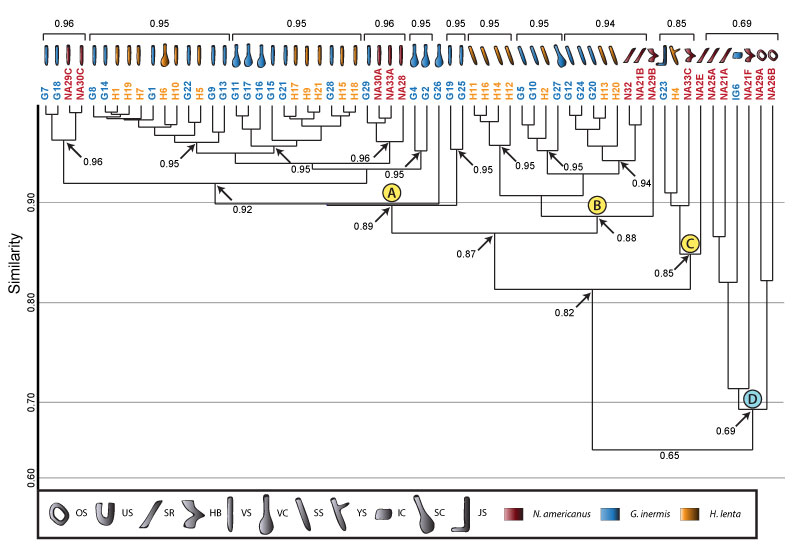
FIGURE 24. Combined cluster analysis of burrows produced by all arthropods considered in this study. Clusters A, B, C, and D consist of burrows produced by small arachnids and millipedes. Clusters E and F consist of burrows produced by large arachnids and millipedes. The burrow architectures placed into each cluster and the tracemaker are indicated by symbols above each cluster. Multiple species boxes placed below a burrow symbol mean each species produced that burrow architecture and that it is placed into that cluster. Formatting and key is the same as in Figures 16 and 21.