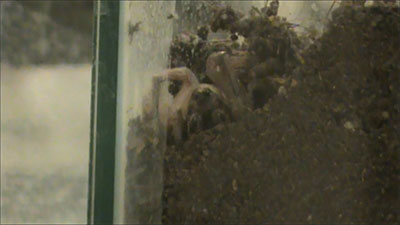
APPENDIX 1.
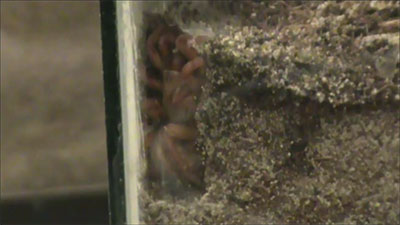
Video of Hogna lenta using compaction burrowing technique. Click on image to run movie.
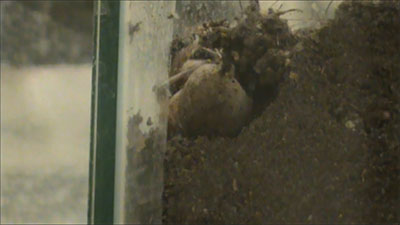
APPENDIX 2.
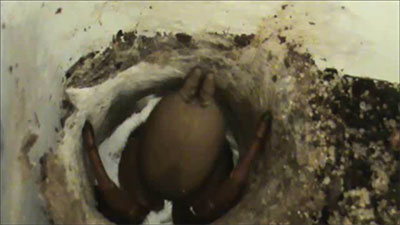
Video of Hogna lenta depositing silk on compacted sediment and glass of the terrarium. Click on image to run movie.
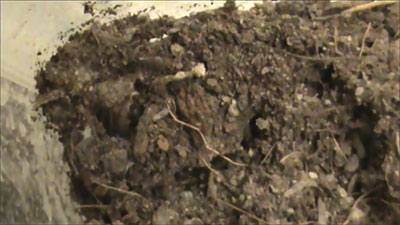
APPENDIX 3.
Video of Hogna lenta gathering sediment with silk to form a trapdoor. Click on image to run movie.
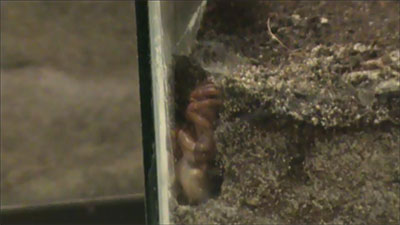
APPENDIX 4.
Video of Gorgyrella inermis using silk to gather material into a bundle. Click on image to run movie.
APPENDIX 5.
Video of Gorgyrella inermis gathering silken bundle of sediment and removing it from the burrow. Click on image to run movie.
APPENDIX 6.
Video of Gorgyrella inermis depositing silk along the sides of its burrow. Click on image to run movie.
APPENDIX 7.
Quantitative data for the burrows produced by Aphonopelma chalcodes. All measurements in cm. SR = subvertical ramp.
| |
A1 |
A2 |
| Architecture |
SR |
SR |
| |
|
|
| Surface Openings |
1 |
1 |
| |
|
|
| Maximum depth |
9.5 |
3.1 |
| |
|
|
| Total Length |
17.9 |
6.1 |
| |
|
|
| Maximum width |
7.6 |
3.7 |
| Minumum width |
3.6 |
2.9 |
| Mean width |
6.6 |
3.4 |
| |
|
|
| Maximum height |
6.7 |
2.4 |
| Minimum height |
2.5 |
1.2 |
| Mean height |
5.1 |
1.9 |
| |
|
|
| Mean W/H ratio |
0.77 |
0.55 |
| |
|
|
| Maximum circumference |
22.2 |
10.9 |
| Minimum circumference |
11.1 |
7.1 |
| Mean circumference |
19.14 |
9.46 |
| |
|
|
| Maximum slope |
55° |
25° |
| Minimum slope |
0° |
25° |
| Mean slope |
27.5° |
25° |
| |
|
|
| Branching angles |
NA |
NA |
| |
|
|
| Complexity |
3 |
2 |
| |
|
|
| Tortuosity |
0.52 |
0.98 |
| |
|
|
APPENDIX 8.
Bray-Curtis result matrix for Aphonopelma chalcodes. This matrix displays the comparison of burrows produced by Gorgyrella inermis, Hogna lenta, and A. chalcodes . Cells are filled in black where burrows are compared to themselves. Cells with scores of high (1.0-0.8), moderate (0.7-0.6) to low (0.5-0.3) similarity are filled in blue with increasing lightness. See Table 1 and Appendix 7 for architecture key. (PDF only)
APPENDIX 9.
Quantitative data for the burrows produced by Hadrurus arizonensis. All measurements in cm. SR = subvertical ramp, HB = helical burrow, MW = mazework, UB = U-shaped burrow.
| |
DHS1 |
DHS2 |
DHS3 |
DHS4 |
DHS5 |
DHS6 |
DHS7 |
DHS8 |
DHS9 |
DHS10 |
DHS11 |
DHS12 |
DHS13 |
DHS14 |
DHS15 |
DHS16 |
DHS17 |
| Architecture |
SR |
SR |
HB |
MW |
MW |
SR |
HB |
MW |
UB |
SR |
SR |
SR |
SR |
SR |
HB |
SR |
SR |
| |
|
|
|
|
|
|
|
|
|
|
|
|
|
|
|
|
|
| Surface Openings |
1 |
1 |
1 |
5 |
4 |
1 |
1 |
3 |
2 |
1 |
1 |
1 |
1 |
1 |
1 |
1 |
1 |
| |
|
|
|
|
|
|
|
|
|
|
|
|
|
|
|
|
|
| Maximum depth |
3.9 |
2.8 |
7.2 |
7.4 |
6.7 |
4.3 |
4.6 |
8.4 |
8 |
3 |
4.2 |
3.4 |
4 |
4.2 |
16 |
5.3 |
6.8 |
| |
|
|
|
|
|
|
|
|
|
|
|
|
|
|
|
|
|
| Total Length |
11 |
9 |
27 |
57 |
46 |
7 |
13 |
31 |
30 |
16 |
11 |
19 |
19 |
23 |
76 |
37 |
26 |
| |
|
|
|
|
|
|
|
|
|
|
|
|
|
|
|
|
|
| Maximum width |
4.3 |
6 |
7.7 |
4.6 |
6.4 |
5.9 |
3.3 |
7.2 |
4.2 |
5.2 |
4.4 |
6.5 |
4.9 |
6.7 |
5.3 |
6.2 |
5.4 |
| Minumum width |
3.2 |
3 |
2.8 |
1.9 |
2.6 |
2.9 |
2.7 |
2.9 |
3 |
3.8 |
4.1 |
4.2 |
3.1 |
4.1 |
3.7 |
3.1 |
4 |
| Mean width |
3.9 |
4.8 |
4.5 |
3.6 |
4.2 |
4.2 |
3.1 |
4.7 |
3.6 |
4.4 |
4.3 |
5.2 |
4.1 |
4.9 |
4.5 |
4.8 |
4.9 |
| |
|
|
|
|
|
|
|
|
|
|
|
|
|
|
|
|
|
| Maximum height |
2.8 |
1.9 |
3.2 |
2.3 |
3.1 |
1.6 |
1.4 |
2.6 |
2.5 |
2.1 |
2 |
3.3 |
2.6 |
2.3 |
3.3 |
2.8 |
2.2 |
| Minimum height |
1 |
1.1 |
0.8 |
0.8 |
1.4 |
1 |
0.6 |
1.4 |
1.5 |
1.3 |
0.9 |
1.9 |
1.8 |
1.4 |
1.6 |
1.7 |
1.5 |
| Mean height |
1.9 |
1.6 |
2 |
1.8 |
1.9 |
1.4 |
1 |
1.9 |
2.1 |
1.8 |
1.6 |
2.2 |
2.2 |
1.7 |
2.3 |
2.4 |
1.8 |
| |
|
|
|
|
|
|
|
|
|
|
|
|
|
|
|
|
|
| Mean W/H ratio |
2.1 |
3 |
2.3 |
2 |
2.2 |
3 |
3.1 |
2.5 |
1.7 |
2.4 |
2.7 |
2.4 |
1.9 |
2.9 |
2 |
2 |
2.7 |
| |
|
|
|
|
|
|
|
|
|
|
|
|
|
|
|
|
|
| Maximum circumference |
12.1 |
14 |
18 |
14.5 |
17 |
11.5 |
10.5 |
16 |
11.5 |
13.6 |
11.2 |
16.5 |
13 |
15.5 |
14 |
15 |
13 |
| Minimum circumference |
10 |
11.2 |
6.5 |
9.5 |
10.5 |
6 |
8.5 |
9.5 |
10.5 |
9.7 |
6.8 |
11.5 |
9.9 |
10.5 |
10 |
11 |
11.5 |
| Mean circumference |
11.2 |
12.7 |
14.5 |
13.1 |
12.2 |
9.4 |
9 |
12.3 |
11.3 |
11.9 |
10 |
13.9 |
11.5 |
12.5 |
17.3 |
12.9 |
12.6 |
| |
|
|
|
|
|
|
|
|
|
|
|
|
|
|
|
|
|
| Maximum slope |
40° |
10° |
30° |
50° |
90° |
30° |
40° |
50° |
90° |
10° |
40° |
10° |
20° |
20° |
30° |
20° |
20° |
| Minimum slope |
0° |
0° |
0° |
0° |
0° |
0° |
0° |
0° |
0° |
0° |
0° |
0° |
0° |
0° |
0° |
0° |
0° |
| Mean slope |
20° |
5° |
15° |
27° |
37° |
15° |
20° |
30° |
45° |
5° |
20° |
5° |
10° |
10° |
13° |
8° |
8° |
| |
|
|
|
|
|
|
|
|
|
|
|
|
|
|
|
|
|
| Branching angles |
NA |
NA |
NA |
75° |
75° |
NA |
NA |
70° |
NA |
NA |
NA |
NA |
NA |
NA |
NA |
65° |
NA |
| |
|
|
|
|
|
|
|
|
|
|
|
|
|
|
|
|
|
| Complexity |
3 |
3 |
3 |
9 |
9 |
3 |
3 |
7 |
4 |
3 |
3 |
3 |
3 |
3 |
3 |
3 |
3 |
| |
|
|
|
|
|
|
|
|
|
|
|
|
|
|
|
|
|
| Tortuosity |
1.1 |
1.1 |
9 |
1.4 |
1.8 |
1.1 |
3.3 |
1.1 |
1.3 |
1.3 |
1.5 |
1.1 |
1.2 |
1.4 |
3.3 |
1.2 |
1.2 |
APPENDIX 10.
Bray-Curtis result matrix for Hadrurus arizonensis,Gorgyrella inermis, and Hogna lenta. Formatting is the same as Appendix 8. See Table 1 and Appendix 9 for architecture key. (PDF only)
APPENDIX 11.
Quantitative data for the burrows produced by Mastigoproctus giganteus. All measurements in cm. SR = subvertical ramp, MW = mazework, UB = U-shaped burrow, VS = vertical shaft.
| |
WS1 |
WS2 |
WS3 |
WS4 |
WS5 |
WS6 |
WS7 |
WS8 |
WS9 |
WS10 |
WS11 |
WS12 |
WS13 |
WS14 |
WS15 |
WS27 |
WS28 |
WS32 |
| Architecture |
UB |
MW |
JS |
SR |
VS |
UB |
JS |
UB |
MW |
JS |
SR |
JS |
SR |
VS |
VS |
SR |
VS |
VS |
| |
|
|
|
|
|
|
|
|
|
|
|
|
|
|
|
|
|
|
| Surface Openings |
2 |
2 |
1 |
1 |
1 |
2 |
1 |
2 |
4 |
1 |
1 |
1 |
1 |
1 |
1 |
1 |
1 |
1 |
| |
|
|
|
|
|
|
|
|
|
|
|
|
|
|
|
|
|
|
| Maximum depth |
7.1 |
10.6 |
11 |
5.6 |
10.1 |
4.9 |
10.7 |
5.7 |
12.4 |
12.5 |
6.6 |
7.7 |
6.1 |
3.4 |
8.1 |
3.3 |
4.9 |
5.8 |
| |
|
|
|
|
|
|
|
|
|
|
|
|
|
|
|
|
|
|
| Total Length |
29 |
39.5 |
18.5 |
12.5 |
10.1 |
16 |
16 |
21 |
66 |
26.5 |
8 |
17.5 |
8.5 |
3.8 |
10.2 |
4 |
5.7 |
6 |
| |
|
|
|
|
|
|
|
|
|
|
|
|
|
|
|
|
|
|
| Maximum width |
7.6 |
8.1 |
4.3 |
3.9 |
6.3 |
3 |
5 |
4 |
6.2 |
6.6 |
3.1 |
6.4 |
3.2 |
2.2 |
4.2 |
2.6 |
3.3 |
3.1 |
| Minumum width |
4.5 |
3.4 |
2.6 |
3.4 |
5.3 |
2.2 |
2.4 |
2.9 |
3.7 |
2.6 |
2.8 |
2.7 |
2.8 |
1.9 |
2.7 |
1.6 |
2.2 |
2.5 |
| Mean width |
5.7 |
5.4 |
3.6 |
3.7 |
5.8 |
2.4 |
3.4 |
3.4 |
4.6 |
4.1 |
3 |
4.7 |
3.1 |
2.1 |
3.4 |
2.1 |
2.7 |
2.8 |
| |
|
|
|
|
|
|
|
|
|
|
|
|
|
|
|
|
|
|
| Maximum height |
3.2 |
4.3 |
2.8 |
2.1 |
2.9 |
1.7 |
2.3 |
2 |
2 |
2.4 |
2.9 |
2.5 |
2.1 |
1.1 |
4.4 |
1.9 |
1.9 |
1.3 |
| Minimum height |
2.5 |
1.5 |
2 |
1.7 |
1.9 |
1.3 |
1.7 |
1.5 |
1.7 |
1.2 |
2.2 |
1.9 |
1.8 |
0.9 |
1.5 |
1.1 |
1.6 |
1.2 |
| Mean height |
2.8 |
2.9 |
2.3 |
1.9 |
2.2 |
1.6 |
2 |
1.7 |
1.9 |
1.9 |
2.6 |
2.2 |
1.9 |
1 |
2.6 |
1.5 |
1.7 |
1.3 |
| |
|
|
|
|
|
|
|
|
|
|
|
|
|
|
|
|
|
|
| Mean W/H ratio |
2 |
1.9 |
1.6 |
1.9 |
2 |
1.5 |
1.7 |
2 |
2.4 |
2.2 |
1.2 |
2.1 |
1.6 |
2.1 |
1.3 |
1.4 |
1.6 |
2.2 |
| |
|
|
|
|
|
|
|
|
|
|
|
|
|
|
|
|
|
|
| Maximum circumference |
19 |
26.5 |
12 |
11 |
17 |
9.5 |
12.5 |
11 |
14.5 |
16 |
12 |
17 |
10.5 |
7.5 |
14.5 |
8 |
9.5 |
8 |
| Minimum circumference |
13.5 |
10 |
9.5 |
10 |
15.5 |
7.5 |
8 |
9.5 |
9 |
7.5 |
11.5 |
10.5 |
9 |
7 |
8 |
6.6 |
7.5 |
7.5 |
| Mean circumference |
15.9 |
17 |
10.9 |
10.5 |
16.3 |
8.3 |
9.9 |
10.5 |
11.3 |
10.8 |
11.8 |
13.9 |
10 |
7.3 |
11 |
7.3 |
8.3 |
7.7 |
| |
|
|
|
|
|
|
|
|
|
|
|
|
|
|
|
|
|
|
| Maximum slope |
70° |
90° |
80° |
30° |
90° |
50° |
70 |
50° |
80° |
90° |
50° |
90° |
50° |
90° |
90° |
60° |
90° |
85° |
| Minimum slope |
0° |
0° |
40° |
10° |
90° |
0° |
0° |
0° |
0° |
40° |
50° |
0° |
50° |
70 |
80° |
60° |
70° |
80° |
| Mean slope |
47° |
35° |
60° |
20° |
90° |
33° |
40° |
30° |
45° |
65° |
50° |
45 |
50° |
80 |
85° |
60° |
80° |
83° |
| |
|
|
|
|
|
|
|
|
|
|
|
|
|
|
|
|
|
|
| Branching angles |
NA |
90° |
NA |
NA |
NA |
NA |
NA |
NA |
80° |
NA |
NA |
90° |
NA |
NA |
NA |
NA |
NA |
NA |
| |
|
|
|
|
|
|
|
|
|
|
|
|
|
|
|
|
|
|
| Complexity |
4 |
7 |
2 |
2 |
2 |
3 |
3 |
3 |
10 |
3 |
2 |
4 |
2 |
2 |
2 |
2 |
2 |
2 |
| |
|
|
|
|
|
|
|
|
|
|
|
|
|
|
|
|
|
|
| Tortuosity |
2.4 |
1.7 |
1.2 |
1.3 |
1 |
1.6 |
1.3 |
1.4 |
1.4 |
1.3 |
1.1 |
1.7 |
1 |
1 |
1.2 |
1 |
1 |
1 |
| |
|
|
|
|
|
|
|
|
|
|
|
|
|
|
|
|
|
|
APPENDIX 12.
Bray-Curtis result matrix for Mastigoproctus giganteus , Gorgyrella inermis, and Hogna lenta. Formatting is the same as Appendix 8. See Table 1 and Appendix 11 for architecture key. (PDF only)
APPENDIX 13.
Quantitative data for the burrows produced by Narceus americanus. All measurements in cm unless otherwise noted. SV = subvertical burrow, VS = vertical shaft, HB = helical burrow, OS = O-shaped burrow.
| |
NA32 |
NA23 |
NA25A |
NA21A |
NA21B |
NA28 |
NA29C |
NA30A |
NA30C |
NA33A |
NA33C |
NA29B |
NA21F |
NA29A |
NA26B |
| Architecture |
SV |
SV |
SV |
SV |
SV |
VS |
VS |
VS |
VS |
VS |
HB |
HB |
HB |
OS |
OS |
| |
|
|
|
|
|
|
|
|
|
|
|
|
|
|
|
| Surface Openings |
1 |
1 |
1 |
1 |
1 |
1 |
1 |
1 |
1 |
1 |
1 |
1 |
1 |
1 |
1 |
| |
|
|
|
|
|
|
|
|
|
|
|
|
|
|
|
| Maximum depth |
4.1 |
6.7 |
3 |
1.9 |
4 |
2.4 |
1.9 |
2.5 |
2.3 |
3.1 |
2.95 |
3.4 |
2.9 |
3.4 |
6.9 |
| |
|
|
|
|
|
|
|
|
|
|
|
|
|
|
|
| Total Length |
4.3 |
8.2 |
9.4 |
2.34 |
4.3 |
3 |
1.9 |
2.5 |
2.6 |
3.1 |
6.8 |
10.7 |
10 |
10.6 |
12.5 |
| |
|
|
|
|
|
|
|
|
|
|
|
|
|
|
|
| Maximum width (mm) |
0.93 |
1.69 |
1.17 |
1.30 |
1.45 |
1.40 |
1.17 |
0.93 |
1.04 |
1.20 |
1.18 |
1.06 |
1.65 |
1.29 |
1.80 |
| Minumum width (mm) |
0.85 |
0.8 |
0.78 |
1.05 |
1.1 |
1.4 |
1.17 |
0.7 |
0.93 |
1.04 |
0.7 |
0.74 |
0.68 |
0.83 |
0.74 |
| Mean width (mm) |
0.88 |
1.04 |
1.02 |
1.18 |
1.24 |
1.40 |
1.17 |
0.82 |
0.99 |
1.12 |
0.96 |
0.84 |
1.16 |
1.05 |
1.09 |
| |
|
|
|
|
|
|
|
|
|
|
|
|
|
|
|
| Maximum height (mm) |
0.98 |
0.95 |
1.01 |
1.25 |
1.23 |
1.38 |
0.9 |
0.88 |
0.93 |
1.47 |
1.17 |
0.92 |
1.15 |
0.96 |
1.13 |
| Minimum height (mm) |
0.86 |
0.73 |
0.57 |
1.18 |
1.05 |
0.95 |
0.9 |
0.77 |
0.8 |
1.11 |
0.85 |
0.61 |
0.8 |
0.6 |
0.67 |
| Mean height (mm) |
0.92 |
0.83 |
0.79 |
1.22 |
1.14 |
1.17 |
0.90 |
0.83 |
0.87 |
1.29 |
0.98 |
0.78 |
0.97 |
0.82 |
0.93 |
| |
|
|
|
|
|
|
|
|
|
|
|
|
|
|
|
| Mean W/H ratio |
0.96 |
1.26 |
1.31 |
0.96 |
1.08 |
1.24 |
1.30 |
0.98 |
1.14 |
0.89 |
0.98 |
1.10 |
1.21 |
1.29 |
1.17 |
| |
|
|
|
|
|
|
|
|
|
|
|
|
|
|
|
| Maximum circumference |
3 |
4.1 |
3.7 |
4.2 |
4.3 |
5 |
3.5 |
2.8 |
3.1 |
4.3 |
4.3 |
3 |
4.3 |
3.5 |
4.8 |
| Minimum circumference |
2.7 |
2.7 |
2.5 |
3.5 |
3.3 |
3.7 |
3.5 |
2.4 |
2.8 |
3.5 |
2.3 |
2.5 |
2.3 |
2.7 |
2.3 |
| Mean circumference |
2.8 |
3.1 |
3.1 |
3.9 |
3.7 |
4.4 |
3.5 |
2.6 |
3.0 |
3.9 |
3.1 |
2.7 |
3.4 |
3.1 |
3.4 |
| |
|
|
|
|
|
|
|
|
|
|
|
|
|
|
|
| Maximum slope |
70° |
65° |
45° |
33° |
73° |
85° |
80° |
90° |
80° |
90° |
80° |
60° |
55° |
60° |
60° |
| Minimum slope |
70° |
50° |
25° |
33° |
70° |
85° |
80° |
90° |
80° |
90° |
50° |
60° |
0° |
15° |
60° |
| Mean slope |
70° |
38.3° |
35° |
33° |
71.5° |
85° |
80° |
90° |
80° |
90° |
65° |
75° |
25° |
37.5° |
60° |
| |
|
|
|
|
|
|
|
|
|
|
|
|
|
|
|
| Branching angles |
NA |
NA |
NA |
NA |
NA |
NA |
NA |
NA |
NA |
NA |
NA |
90° |
NA |
NA |
NA |
| |
|
|
|
|
|
|
|
|
|
|
|
|
|
|
|
| Complexity |
2 |
2 |
2 |
2 |
2 |
2 |
2 |
2 |
2 |
2 |
2 |
4 |
4 |
3 |
3 |
| |
|
|
|
|
|
|
|
|
|
|
|
|
|
|
|
| Tortuosity |
1 |
1.2 |
1.7 |
1 |
1.1 |
1.3 |
1 |
1 |
1.1 |
1 |
2.3 |
1.5 |
1.2 |
43 |
39 |
| |
|
|
|
|
|
|
|
|
|
|
|
|
|
|
|
APPENDIX 14.
Bray-Curtis result matrix for Narceus americanus, Gorgyrella inermis, and Hogna lenta. Formatting is the same as Appendix 8. See Table 1 and Appendix 13 for architecture key. (PDF only)


