FIGURE 1. Compiled stratigraphic chart based on the Geological Time Scale 2012 (Gradstein et al., 2012) with correlation of regional units and biozones. The boundaries of the intervals used by Wenz (1923-1930) are adapted to those of the current stages. The color code corresponds to the colors in the supplied kml-file. For information about the sources see Methods chapter.
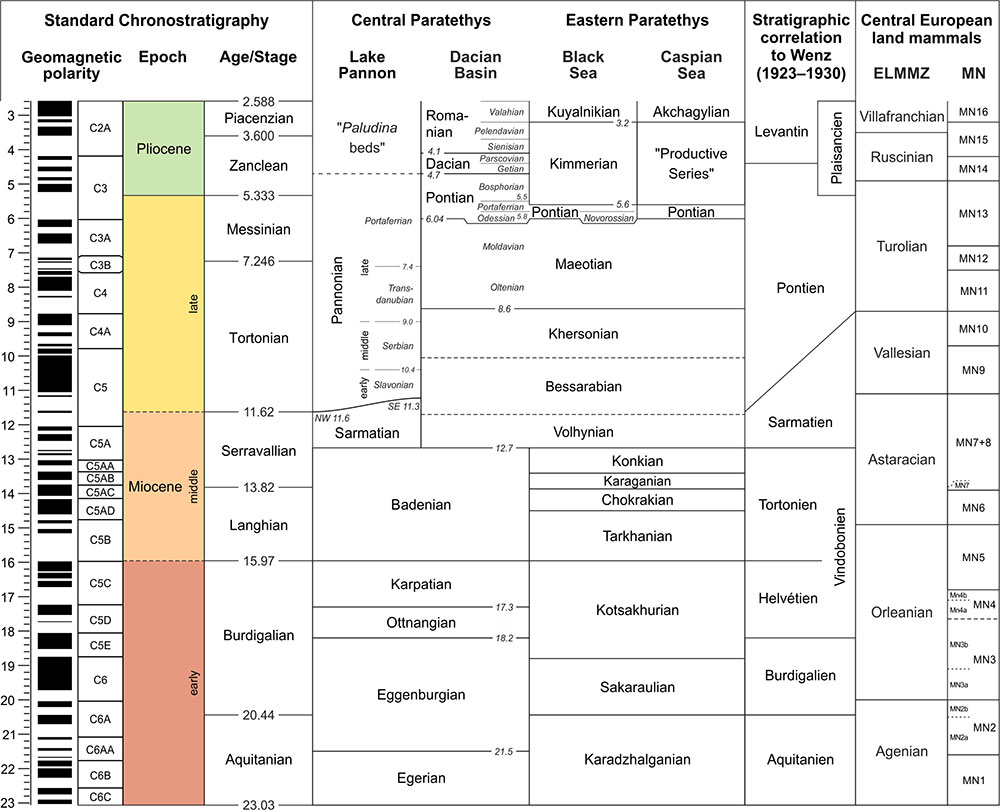
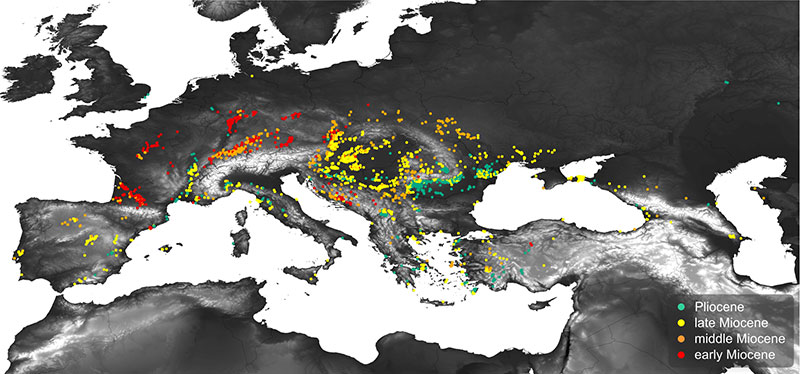
FIGURE 2. European Neogene localities with freshwater gastropod faunas reported in the literature (WGS 84 projection). For complete data see supplied online material. The underlying digital height model derives from Hijmans et al. (2005) and is freely available from www.worldclim.org.