FIGURE 1. Fourier-Transform Infrared spectrograph of the three existing polymers. Wavenumber refers to the wavelength of light and % Transmission refers to the amount of each wavelength that is transmitted through the sample. These are the parameters measured by the spectrometer to achieve an infra-red spectrum. Each peak is indicative of a different chemical bond and different substances will produce distinct patterns.
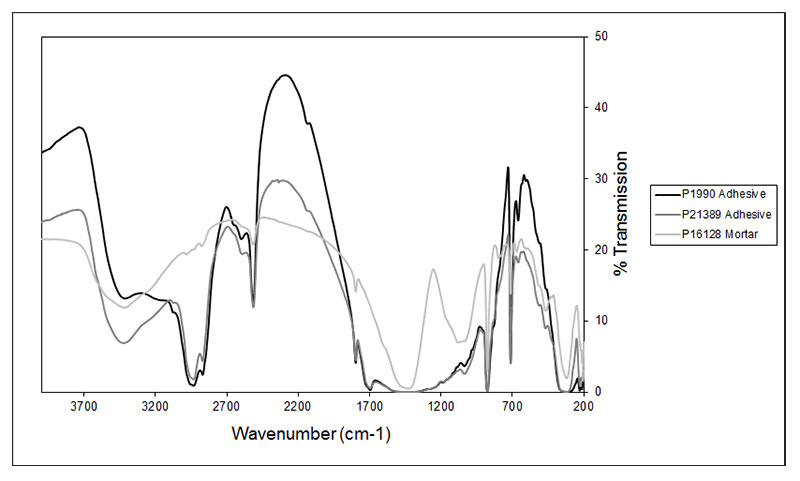
FIGURE 2. Specimen NHMUK PV P1990 during preparation. 1, the block split into halves, showing mortar. 2, The underside of the block set in resin, the majority of the matrix has been removed mechanically. 3, The top of the block, with the exposed fossil, embedded in resin.
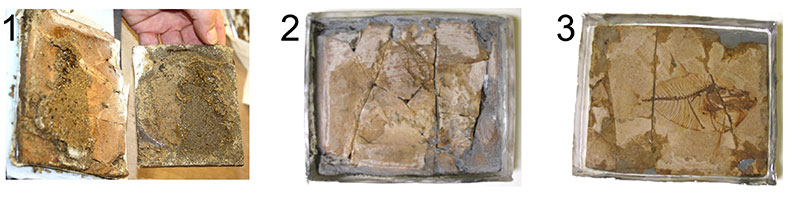
FIGURE 3. 1, Yellowed resin shows dimpled (etched) surface. A glass plate has been added to enhance clarity. 2, Yellowed resin displaying severe cracking and near opacity.
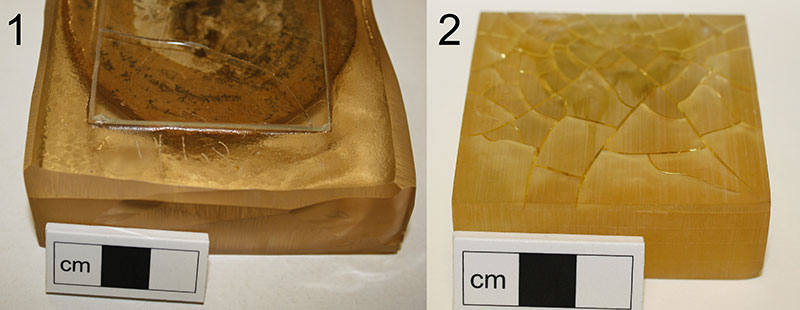
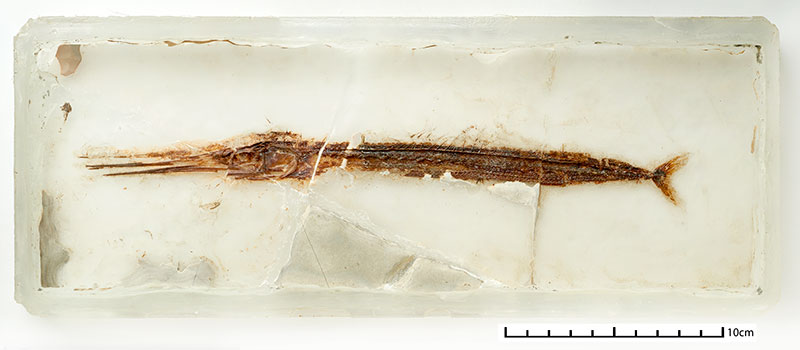
FIGURE 4. NHMUK PV P1990 after complete preparation.
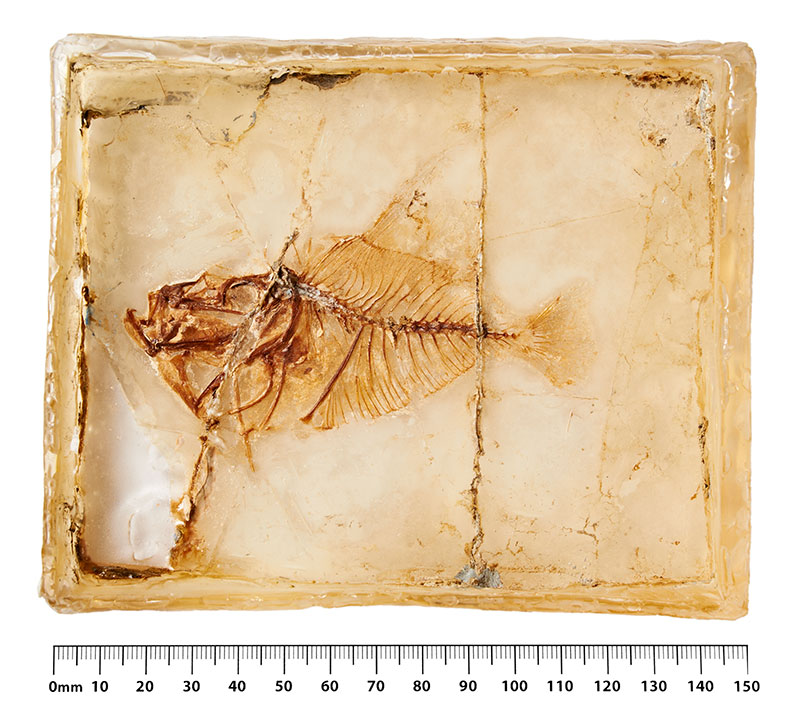
FIGURE 5. Oxford University Museum specimen CM4312 Blochius longirostris , set in Synolite 0328-A-1.