APPENDIX 1.
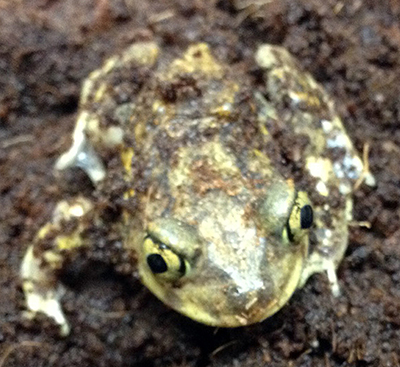
Video of Scaphiopus holbrookii burrowing in an organic-rich sediment. Click on image to run animation.
APPENDIX 2.
Mann-Whitney (MW) and Kolmogorov-Smirnov (KS) test results (p values) from the comparison of burrow properties in each of the clusters generated when comparing burrows of Scaphiopus holbrookii (see Figure 8). 1, Burrows in Cluster 1 compared to those in Clusters 2-4. 2, Burrows in Cluster 2 compared to those in Clusters 3 and 4. 3, Burrows in Cluster 3 compared to those in Cluster 4. Highlighted values in the upper tables indicate statistical difference (p < 0.05). Mean, median, standard deviation, and range are given in the lower tables for burrow properties that are statistically different. Highlighted values of properties in the lower tables are the greater of the two. Electronic file available.
APPENDIX 3.
Mann-Whitney (MW) and Kolmogorov-Smirnov (KS) test results ( p values) from the comparison of the properties of burrows produced by Scaphiopus holbrookii and Pandinus imperator (see Figure 10). 1, All burrows produced by S. holbrookii compared to all burrows produced by P. imperator. 2, Burrows in Cluster A compared to those in Cluster B. See Appendix 2 caption for further table description. Electronic file available.
APPENDIX 4.
Mann-Whitney (MW) and Kolmogorov-Smirnov (KS) test results ( p values) from the comparison of the properties of burrows produced by Scaphiopus holbrookii and Mabuya multifasciata (see Figure 11) . 1, All burrows produced by S. holbrookii compared to all burrows produced by M. multifasciata. 2, Burrows in Cluster A compared to those in Clusters B and C. 3, Burrows in Cluster B compared to those of Cluster C. See Appendix 2 caption for further table description. Electronic file available.
APPENDIX 5.
Mann-Whitney (MW) and Kolmogorov-Smirnov (KS) test results ( p values) from the comparison of the properties of burrows produced by Scaphiopus holbrookii and Ambystoma tigrinum (see Figure 12). 1, All burrows produced by S. holbrookii compared to all burrows produced by A. tigrinum. 2, Burrows in Clusters A, B, C and D compared to those in Cluster E. 3, Burrows in Cluster A compared to those in Clusters B, C, and D. 4, Burrows in Cluster B compared to those in Clusters C and D. 5, Burrows in Cluster C compared to those in Cluster D. See Appendix 2 caption for further table description. Electronic file available.
APPENDIX 6.
Mann-Whitney (MW) and Kolmogorov-Smirnov (KS) test results ( p values) from the comparison of the properties of burrows produced by Scaphiopus holbrookii, Pandinus imperator, Mabuya multifasciata, and Ambystoma tigrinum (see Figure 13). 1, Burrows in Cluster A compared to those in Clusters B, C, D, E, and F. 2, Burrows in clusters B and C compared to those in E and F. 3, Burrows in Clusters B and C compared to those in Cluster D. 4, Burrows in Cluster B compared to those in Cluster C. 5, Burrows in Cluster E compared to those in Cluster F. See Appendix 2 caption for further table description. Electronic file available.
APPENDIX 7.
Burrow properties and the resulting mean, median, standard deviation, maximum, minimum, and range values for individual clusters generated when comparing properties of burrows produced by Scaphiopus holbrookii, Pandinus imperator, Mabuya multifasciata, and Ambystoma tigrinum (See Figure 13). 1, Cluster A. 2, Cluster B. 3, Cluster C. 4, Cluster D. 5, Cluster E. 6, Cluster F. Highlighted values indicate burrow properties that are similar within an individual cluster based on standard deviation and range. Electronic file available.
APPENDIX 8.
Mann-Whitney (MW) and Kolmogorov-Smirnov (KS) test results (p values) from the comparison of the properties of burrows produced by Scaphiopus holbrookii in varying sediment compositions. Highlighted values indicate statistical difference (p < 0.05). O = 100% organic coconut fiber, LOS = layered 100% organic coconut fiber and sand, MOS = homogenized mixture of 100% organic coconut fiber and sand. Electronic file available.
APPENDIX 9.
Mann-Whitney (MW) and Kolmogorov-Smirnov (KS) test results (p values) from the comparison of the properties of burrows produced by Scaphiopus holbrookii during 10-14 day and 30-40 day trials. Highlighted values indicate statistical differences (p < 0.05). Electronic file available.


