FIGURE 1. Size differences between Ailurus fulgens (1) and the two known skeletons of Pristinailurus bristoli (ETMNH 3596, 2; ETMNH 15000, 3). Shaded bones represent recovered elements from the two fossil skeletons.
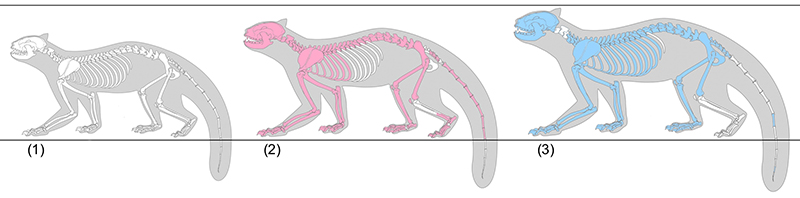
FIGURE 2. (1) Boxplot of Ailurus fulgens lower canine area by sex. (2) Boxplot of A. fulgens upper canine area by sex. Horizontal bars indicate the median, boxes represent middle quartiles, and error bars extend 1.5 times the interquartile range. Open circles beyond these bars indicate outliers.
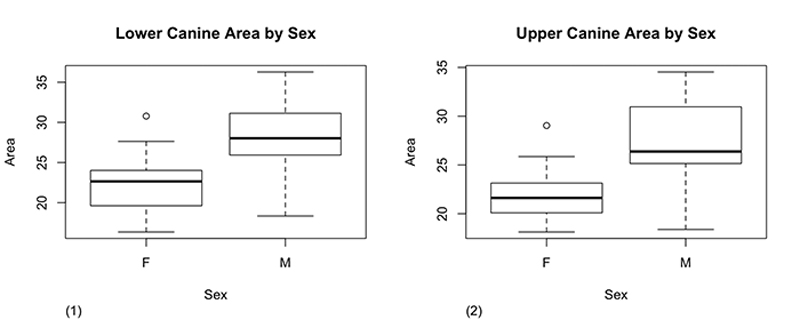
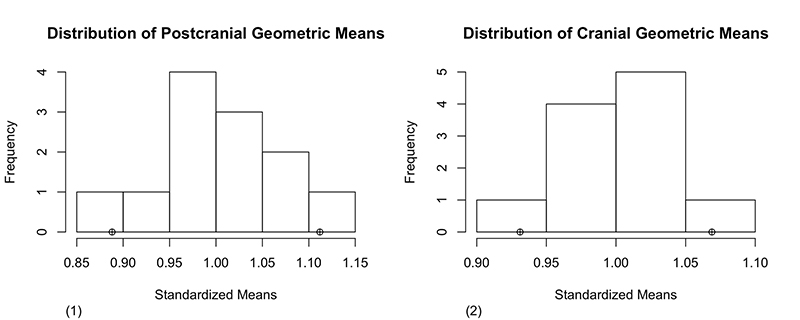
FIGURE 3. (1) Position of the standardized postcranial geometric means of the Pristinailurus bristoli within the standardized postcranial geometric mean distribution of a modeled Ailurus fulgens population. (2) Position of the standardized cranial geometric means of the P. bristoli pair within the standardized cranial geometric mean distribution of a modeled A. fulgens population.