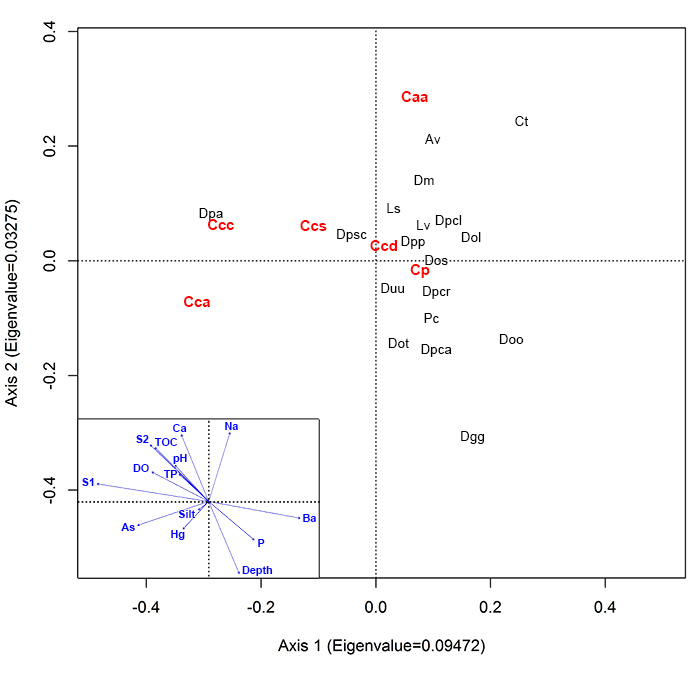
FIGURE 1. Map of the study region showing location of the sampled lakes (red triangles and black circles). The red triangles represent sample stations where Centropyxis pontigulasiformis was observed, while black circles characterize stations where the species was not detected. The numbers represent the sampling order, which corresponds to the sample identification codes shown in Table 1.
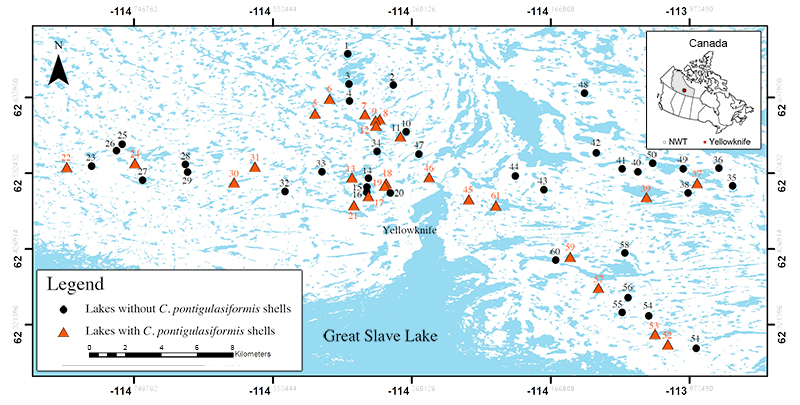
FIGURE 2. Light photomicrographs of the type illustrations of Centropyxis pontigulasiformis (as published by Beyens et al., 1986, plate 3, 1-5). 1, apertural view of the test; 2, lateral view of the test; 3, apertural view of the test; 4, apertural view of the test; and 5, a close-up on the circular aperture without the flange. The length of the scale bars represent 40 μm. Permission to reprint Beyens et al. (1986, plate 3, 1-5) was granted by Acta Protozoologica.
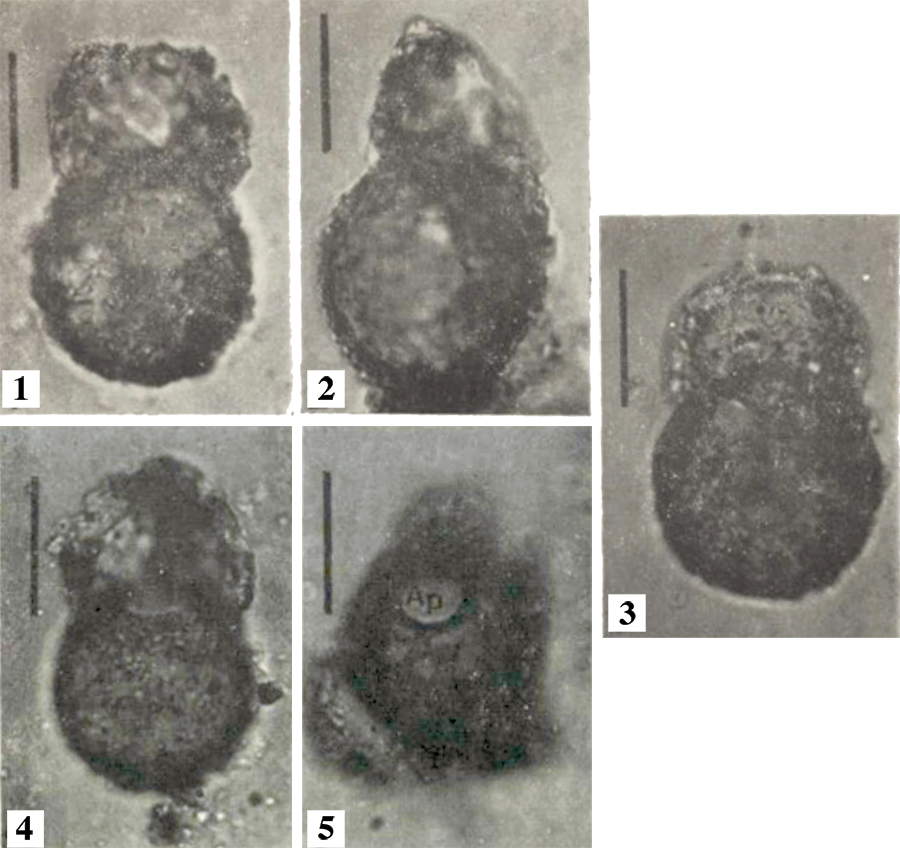
FIGURE 3. Specimens of Centropyxis aculeata (Ehrenberg, 1832), the type species of genus Centropyxis . 1, redrafted sketches of C. aculeata from Leidy (1879, plate 31) (modified after Medioli and Scott, 1983, figure 11) showing some of the typical morphotypes within the species. 2 and 3, scanning electron microscope of specimens from the lakes in the Yellowknife region, NT, Canada; ventral-apertural view showing the most common test morphology with semi-circular aperture and long spines extending from the fundus and very fine grained agglutination on ventral surface (2) and dorsal view showing xenogenous agglutination comprised both of diatom frustules and mineral grains (3).
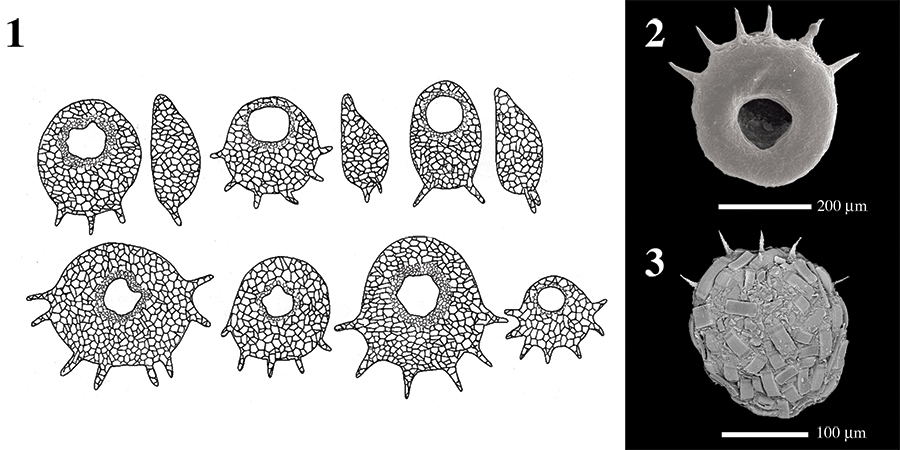
FIGURE 4. Specimens of Conicocassis pontigulasiformis gen. et comb. nov. from lakes in Yellowknife region, Northwest Territories, Canada. 1, dorsal view of a specimen from sample BC8 showing the distinct main test body and distinctive upper funnel-like flange; 2, apertural view of a specimen collected from sample BC12 showing large aperture; 3, dorsal view of a specimen from sample BC12 with agglutination primarily comprised of large xenogenous particles; 4, oblique view of a test collected from sample BC37 showing orientation of large flange relative to apertural opening; 5, edge view of a specimen in sample BC12 showing the distinctive morphology of the main test body relative to asymmetric flange; and 6, a close-up of the flange of a specimen collected from sample BC12 clearly showing that pennate diatoms, pollen grains and mineral particles are important components of the agglutination of this specimen.
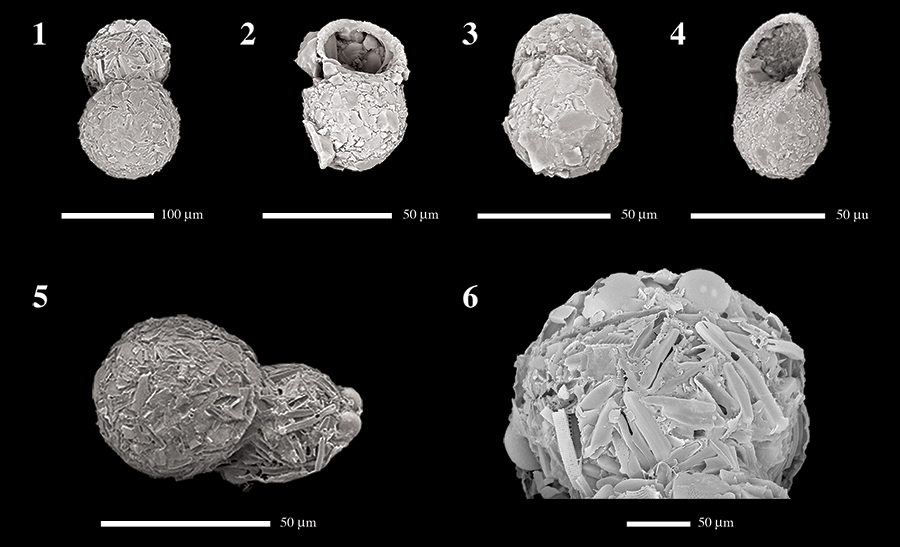
FIGURE 5. Detrended Correspondence Analysis (DCA) bi-plot based on species scores showing the faunal distribution of arcellininid species and strains in the Yellowknife region. Abbreviations: Av, Arcella vulgaris; Caa, Centropyxis aculeata “aculeata”; Cad, Centropyxis aculeata “discoides”; Cca, Centropyxis constricta “aerophila”; Ccc, Centropyxis constricta “constricta”; Ccs, Centropyxis constricta “spinosa”; Cp, Conicocassis pontigulasiformis; Ct, Cucurbitella tricuspis; Dgg, Difflugia glans “glans”; Dol, Difflugia oblonga “lanceolata”; Doo, Difflugia oblonga “oblonga”; Dos, Difflugia oblonga “spinosa”; Dot, Difflugia oblonga “tenuis”; Dpa, Difflugia protaeiformis “amphoralis”; Dpac, Difflugia protaeiformis “acuminata”; Dpcl, Difflugia protaeiformis “claviformis”; Dpcr, Difflugia protaeiformis “curvicaulis”; Dpp, Difflugia protaeiformis “protaeiformis”; Dpsc, Difflugia protaeiformis “scalpellum”; Duu, Difflugia urceolata “urceolata”; Ls, Lesquereusia spiralis; Lv, Lagenodifflugia vas; Mc, Mediolus coron; Pc, Pontigulasia compressa.
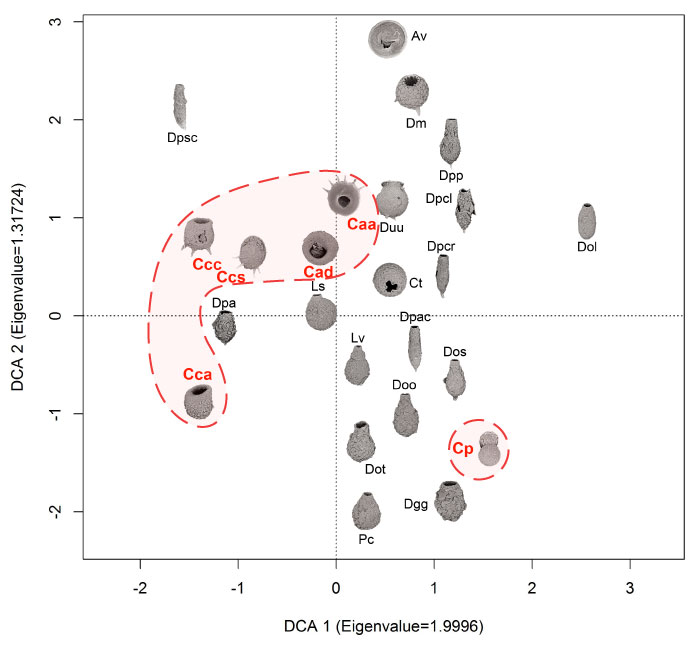
FIGURE 6. Redundancy Analysis (RDA) species-environment-sample tri-plot. Environmental variables (arrows) are shown in the inset to avoid a clutter. Abbreviations: As, arsenic; Ba, barium; Ca, calcium; DO, dissolved oxygen; Hg, mercury; Na, sodium; P, phosphorous; S1, S1 carbon; S2, S2 carbon; TOC, total organic carbon; TP, total phosphorous. See Figure 5 caption for other abbreviations.