 Non-linear ontogenetic shape change in Cryptolithus tesselatus (Trilobita) using three-dimensional geometric morphometrics
Article number: 19.3.42A
https://doi.org/10.26879/665
Copyright Palaeontological Association, October 2016
Author biographies
Plain-language and multi-lingual abstracts
PDF version
Submission: 23 March 2016. Acceptance: 25 August 2016
{flike id=1621}
ABSTRACT
A decrease in the rate of cephalic shape change late in ontogeny has been documented for several species of trilobites, possibly associated with the cessation of segment release into the thorax. Qualitative descriptions of the ontogeny of Cryptolithus tesselatus Green, 1832, suggest that shape change in the cephalon was strongly influenced by the progressive accommodation of large funnel-shaped perforations (“fringe-pits”) over several molts. The number and arrangement of fringe-pits was established early in ontogeny, however, before thoracic segment release was completed. Due to the unusual and highly convex shape of the cephalon, we use three-dimensional (3D) geometric morphometrics to quantify shape change in this species and determine if there is a rate shift, and at what point in development this shift occurred. Three-dimensional morphometrics was made possible by extracting fixed and semi-landmarks from surface reconstructions of C. tesselatus rendered from CT scans of silicified specimens. Results show that the cephalon continued to change shape into adulthood, but that a threshold model with a rate shift associated with the cessation of new fringe-pits is best supported. 2D landmarks taken from the dorsal view fail to capture the dramatic change in convexity of the cephalon during development, but model comparison results are consistent with those based on the 3D landmark dataset, allowing comparison of this aspect of ontogenetic change with other species. Based on these comparisons, it appears that 1) trajectories are often better characterized by threshold models than simple linear regression models; 2) the timing of shifts may not be phylogenetically conserved.
Melanie J. Hopkins. Division of Paleontology, American Museum of Natural History, Central Park West at 79th Street, New York, NY 10024, USA. mhopkins@amnh.org
J. Kirk Pearson. Department of Geology, Oberlin College, Carnegie Building, 52 West Lorain Street, Oberlin, OH 44074, USA. kirkpear@gmail.com
Keywords: trilobites; CT scanning; silicification; functional morphology; ontogeny
Final citation: Hopkins, Melanie J. and Pearson, J. Kirk. 2016. Non-linear ontogenetic shape change in Cryptolithus tesselatus (Trilobita) using three-dimensional geometric morphometrics. Palaeontologia Electronica 19.3.42A: 1-54.
https://doi.org/10.26879/665
palaeo-electronica.org/content/2016/1621-3d-morphometrics-in-trilobites
INTRODUCTION
Trilobites molted throughout all stages of development, and by virtue of being heavily biomineralized, each shed exoskeleton had the potential to be preserved in the fossil record. Because of this, larval and juvenile trilobites have a good fossil record, and it is possible to reconstruct the morphological changes that occurred throughout ontogeny and compare this across species and to other arthropods. Larval and juvenile characters have been useful for phylogenetic reconstruction (e.g., Fortey and Chatterton, 1988; Edgecombe, 1992; see also Park and Choi, 2011a), and quantification of ontogenetic change has been crucial for studies of heterochronic shifts during speciation (e.g., Gerber and Hopkins, 2011) and for studies of growth and segmentation (e.g., Fusco et al., 2004; Hong et al., 2014). One feature of trilobite ontogeny that has emerged from both qualitative and quantitative descriptions is that ontogenetic change is generally progressive and gradual even though change is achieved incrementally. For example, many species show a posterior shift in the placement of the palpebral lobes (which rest above the eyes) throughout ontogeny, and this change progresses over many molts. However, there is also frequently a decrease in the amount of shape change late in development, and it has been suggested that this shift could be associated with the cessation of segment release into the thorax (e.g., Kim et al., 2002; Hopkins and Webster, 2009; Park and Choi, 2011b; Park et al., 2014).
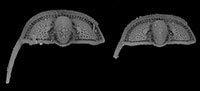
Cryptolithus tesselatus Green, 1832, is a trinucleid trilobite characterized by a cephalic fringe with large funnel-shaped perforations (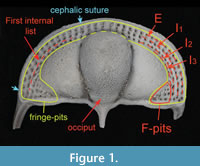 Figure 1). These perforations have traditionally been referred to as pits; hereafter we refer to them as “fringe-pits” to distinguish them from other types of pits. Previous work has shown that 1) the fringe-pits were added to the cephalon over several molts in a consistent order; and 2) addition of new fringe-pits ceased before segment accretion ceased (Whittington, 1959, 1968; Chatterton et al., 1994). Based on this, we expect that the rate of shape change in the cephalon during ontogeny was influenced by the accommodation of the fringe-pits. In this study, we quantify shape change in the cephalon of Cryptolithus tesselatus in order to determine if the ontogeny of this species is better characterized by 1) a shift in the rate of change late in ontogeny, as expected based on other trilobite studies; or 2) a shift in the rate of change when the addition of new fringe-pits ceased.
We use geometric morphometric methods to quantify shape change in the cephalon of Cryptolithus tesselatus. Trilobites have frequently been the focus of geometric morphometric studies because of their complex exoskeletal morphology and robust fossil record, but thus far studies have been restricted to two-dimensional (2D) datasets (Appendix 1). In almost all cases, 2D landmarks were digitized from photographs of the dorsal view of the cranidium/cephalon or pygidium. These studies necessarily assumed that 2D landmark configurations would be adequate for capturing the majority of the shape change of interest. Although this assumption is not unreasonable for taxa that are relatively flat, Cryptolithus tesselatus cephala have considerable convexity that is not captured in dorsal view alone, most notably convex glabellar and genal areas. Because of this, we considered C. tesselatus a good candidate for the first application of 3D morphometrics to trilobite ontogenetic studies.
A major obstacle to applying 3D morphometrics to trilobites is their size, particularly early ontogenetic stages. Tools for directly collecting 3D landmarks (e.g., microscribes) are too imprecise relative to the average size of the trilobite specimen, and methods for rendering 3D models (e.g., high-resolution laser scanning or x-ray computed tomography [CT scanning]) are expensive, limited in availability, and may require extensive post-processing, especially when the latter requires pixel-by-pixel selection in order to separate the specimen from the surrounding rock matrix. One solution to the challenges posed for applying 3D morphometrics is to focus on silicified specimens. Silicified material has great potential for developing 3D models of trilobites, particularly using CT scanning, because individual specimens can be liberated completely from the surrounding matrix, so that all sides of the specimen are visible. Therefore, the density difference between the silica and surrounding air make both scanning and post-processing much less time consuming. In addition, CT scanning technology can image specimens that are tens to hundreds of microns in size, as is the case with larval and early juvenile trilobite specimens.
MATERIALS
Silicified specimens of Cryptolithus tesselatus were obtained from collections at the American Museum of Natural History (AMNH FL-81234 and AMNH FL-81241). Both collections comprise residues from acid dissolution of a single limestone sample (block M-1), collected by Marshall Kay from the Martinsberg Shale at a locality north of Spring Hill, Virginia; thus the specimens are sampled from a “single population” to the extent possible in the fossil record. Trilobite species obtained from dissolving the limestone block were previously described by Chatterton et al. (1990, 1994); Chatterton et al. (1994) also noted that the sampled locality must have been somewhere near locality 11 or 12 of Whittington (1959). Thirty undeformed specimens were selected as candidates for CT scanning, ranging in size from 0.5 to 9 mm in cephalic length (excluding the occipital spine). The largest specimens are of the same size as large holaspid Cryptolithus tesselatus known from other localities (e.g., Whittington, 1941, 1968), so these specimens may be assumed to span the entire ontogeny of C. tesselatus even though articulated material is not available. Several specimens include the lower lamella and genal spine (e.g., Figure 1).
METHODS
CT Scanning
Each specimen of Cryptolithus tesselatus was adhered to the inside lid of a small acrylic box or tube with tragacanth gum, a water-soluble adhesive. Specimens were scanned at the Microscopy and Imaging Facility at the American Museum of Natural History using a GE Phoenix v|tome|x scanner with 240kv microtube. Additional image post-processing and 3D surface rendering was done using VGStudioMax; surface models were exported as polygon files (.ply).
CT scanning of the silicified material was relatively efficient: it took about 30 minutes to scan each specimen and the AMNH Microscopy and Imaging Facility was able to successfully scan 27 specimens of the 30 selected. Post-processing was minimal because of the high density difference between the silica and the surrounding air.
Geometric Morphometrics
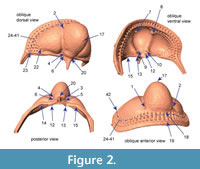 Choice of landmarks. Twenty-four landmarks, 18 semi-landmarks and 21 surface semi-landmarks were digitized using Landmark Editor 3.6, a tool for the placement and registration of coordinates on complex surfaces (Wiley et al., 2007). The first 22 fixed landmarks were chosen because they could be located consistently on each specimen regardless of developmental stage (Figure 2, Appendix 2). In the case of some of these, the specification on a 3D surface representation of the specimen is different than specification of nominally the same landmark from a 2D image of the specimen. For example, the anterior pit located in the axial furrow near the front of the glabella (landmarks 1 and 2) would appear as a dark spot in a photograph, and the coordinates of that spot could be used as the landmark coordinates. However, on a 3D surface model, this same “landmark” is in negative space, essentially floating above the opening to the pit. In order to estimate coordinates associated with these features, we had to select an area directly adjacent: in the case of the anterior pit, we placed the landmark on the periphery at a specified point in relation to the axial furrow. For comparison, we also digitized the apex of the pits on the ventral surface; however, exclusion of these different subsets of landmarks did not influence the overall results and we retained all landmarks in the analyses shown below.
At first glance, the fringe-pits provide a wealth of potential landmarks. However, previous studies have shown that the number of fringe-pits in each concentric arc varies within developmental stages and between localities (e.g., Whittington, 1968). In addition, there is some variation in the placement of fringe-pits; for example, sometimes there is a row of fringe-pits on the sagittal axis and sometimes two rows of fringe-pits on the sagittal axis. Because of this, it is impossible to hypothesize that a particular fringe-pit is homologous with another one on a different specimen. Instead of trying to place landmarks at particular fringe-pits, we placed semi-landmarks along the first internal list; the trajectory of the list as it crosses the posterior border on either side was treated as two additional fixed landmarks at each end of the curve (points 23 and 42, Figure 2, Appendix 2). Thus the curve described by these semi-landmarks captures the shape of the concentric arcs of fringe-pits without relying on dubious homologies. We chose the first internal list because it is often more strongly expressed than the girder list in Cryptolithus tesselatus and because it was preserved across almost all of the scanned specimens (in contrast, some specimens were missing the postero-lateral corners, making it impossible to place landmarks along the entire cephalic border). Because the list runs internally to I2, it can be digitized only from specimens with at least E and I1 (meraspid degree 2 and larger, see Discussion).
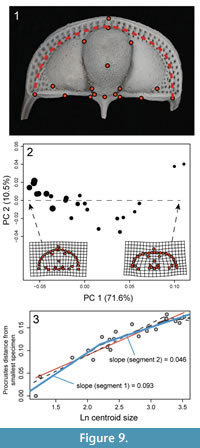
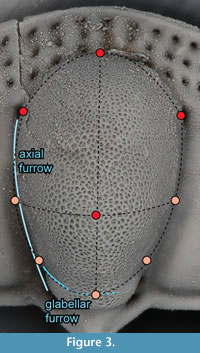 The glabella, and to a lesser extent the genal lobe, is highly convex. However, there are almost no features on these surfaces that can serve as landmarks. Instead we extracted surface semi-landmarks from these features. In Landmark Editor, this is accomplished by placing “patches” over the surface of interest and then specifying the number of landmarks that should be extracted across it. The patch is a grid defined by nine landmarks, which must be placed manually. For the glabella, we were able to identify nine landmarks that could be placed consistently (Figure 3). Along each line of the grid so defined, we extracted five landmarks, for a total of 25 landmarks spread out across the surface of the glabella anterior to the occiput. Four of the landmarks in this patch overlapped with five of the fixed landmarks, so the redundant landmarks were deleted from the dataset, and the remaining 21 landmarks were treated as surface semi-landmarks. Treating all nine hand-placed landmarks as fixed landmarks and the remaining 16 as surface semi-landmarks instead had a negligible effect on the superimposition, and thus did not change the subsequent analyses. Attempts to identify a protocol for placing patches on the genal lobe were unsuccessful because of a lack of reliable features available to pin the patch to. For example, the central point of the grid on the glabella may be linked to the glabellar tubercle but there is no central feature on the genal lobe.
The number of semi-landmarks along the internal list and across the glabella was chosen so that the density of landmarks across the cephalon was uniform. Each specimen was digitized twice in order to assess digitization error. Each landmark was represented by the x-, y-, and z- coordinates of a single pixel, and the set of 67 landmarks was exported as an .nts text file for import into R (R Development Core Team, 2015), at which point redundant landmarks were removed, leaving a total of 63 landmarks. Raw landmark data is available in Appendix 3.
Analytical steps. Of the 27 scanned specimens, 23 were missing no more than 2 landmarks and were used for the geometric morphometric analysis. Missing landmarks were estimated using the thin-plate spline method of Gunz et al. (2009) and implemented using the estimate.missing function of the geomorph package ver. 3.0.1 (Adams and Otarola-Castillo, 2013) for the statistical computer language R (R Development Core Team, 2015). In this implementation, a reference specimen is obtained from the set of specimens for which all landmarks are present. Next, each incomplete specimen is aligned to the reference using the set of landmarks common to both, and then the thin-plate spline is used to estimate the locations of the missing landmarks in the target specimen. Other methods of estimating missing landmarks (see Claude, 2008; Gunz et al., 2009) did not alter the results, nor did reducing the dataset to just the specimens with a complete set of landmarks (N = 20). The landmark configurations were then re-superimposed using generalized Procrustes analysis. The position of semi-landmarks was optimized by minimizing the Procrustes distance between the reference and the target specimen as implemented in the gpagen function in geomorph. Digitizing error was assessed visually using principal components analysis and any outlier specimens were re-digitized. Once digitizing error was minimized (in this case, to the point where the average Procrustes distance between replicates was 0.027 while the average Procrustes distance between specimens was 0.092), all replicates were averaged, and the average Procrustes coordinates were used for all subsequent visualization and analysis.
Allometric curves were constructed by plotting Procrustes distances between each specimen and the smallest specimen against the natural log of centroid size (e.g., Hopkins and Webster, 2009), where centroid size is the square root of the sum of squared distances between each landmark and the centroid. We fitted three threshold models, one with a break at the size range where no more fringe-pits were added (natural log of centroid size = 2.3), one with a break at the size range where specimens are known to have the full complement of thoracic segments (natural log of centroid size = 3.3), and one with a breakpoint at each. These were compared with a fitted linear regression model. The best model was selected using Akaike’s Information Criterion corrected for small sample size (AICc), and AICc weights were used to assess the relative likelihood of each model (Burnham and Anderson, 2002).
RESULTS
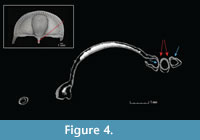 The CT scans reveal the bilaminar structure of the trilobite exoskeleton as well at the structure of the fringe-pits, which are funnel-shaped with small holes at the base. The fringe-pits on the upper and lower lamellae are in contact with each other at their bases, such that the holes meet, creating a series of small orifices through which water may have been able to pass from one side of the cephalon to the other (Figure 4).
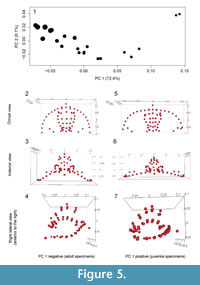
As expected given the targeted sampling of specimens with a large size range, most of the shape variation is associated with size. This is seen clearly in a principal components analysis (Figure 5): 73% of the variation can be summarized along the first principal component and the PC 1 scores are very strongly correlated with log centroid size (R2 = 0.92, p << 0.001). Allometric curves show shape change continuing throughout ontogeny and into holaspis (Figure 6). However, the best supported model was the threshold model where a single shift in rate occurs when no more fringe-pits were being added to the cephalon (Table 1). All threshold models are better supported than the linear regression model.
DISCUSSION
Ontogenetic Change in Cryptolithus tesselatus
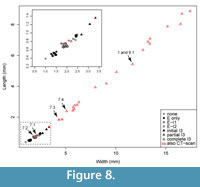
 Previous studies describing the ontogeny of Cryptolithus tesselatus (Whittington, 1959, 1968; Chatterton et al., 1994) have focused on change in the exoskeleton that occurred in early meraspis. In the first few meraspid stages, there was a rapid increase in the number of fringe-pits. Most notably the number of concentric arcs with a “full complement” of fringe-pits increased from 0 to 3 in early meraspid stages (Figure 7). Length-width plots show that size increased sufficiently between molts to allow identification of early meraspid degrees based on size (“instars”) and that the number of arcs is consistent within each instar (Figure 8). Although Whittington (1959) stated that these size classes do not necessarily correspond to meraspid degrees (i.e., the number of thoracic segments), articulated specimens measured by Chatterton et al. (1994)
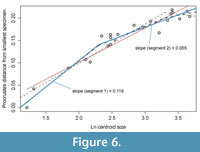 provide evidence that size classes did correspond with both numbers of arcs and numbers of thoracic segments. Based on comparisons between size clusters and counts of concentric arcs, we believe that Chatterton et al. misstated the number of arcs associated with each meraspid degree: meraspid 0 had no arcs of fringe-pits, merapid 1 had one arc, meraspid 2 had two arcs, and meraspid 3 and later had three arcs. For example, see figure 3.10 of Chatterton et al. (1994), which shows an articulated specimen with one thoracic segment and only one apparent concentric arc of fringe-pits behind the cephalic suture. However, we have been unable to confirm this for other articulated specimens figured by Chatterton et al. (1994) because they are currently missing from the AMNH collections, and we have not found any additional articulated specimens in the remaining residues.
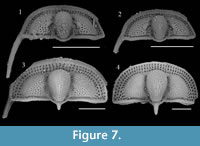 Additional arcs (e.g., I3) appeared in meraspids of about 0.75 mm in cephalic length (Figure 7-Figure 8; Whittington, 1968), but--in contrast to arcs E-I2--were first represented by only one or a few fringe-pits at the posterior margin. Over two successive molts, the number of fringe-pits in arc I3 increased rapidly until the anterior-most was at about the midline of the cephalon and in line with the 10th radial row of fringe-pits in arcs E-I2; specimens as small as 2.5 mm in cephalic length show this (Figure 7-Figure 8). The total number of I3 fringe-pits varied within a short range for all late meraspids and holaspids, even though body size continued to increase four-fold (2 to 8 mm in glabellar length) (Figure 7-Figure 8; Whittington, 1968, figure 6). Apparently this was accommodated by an increase in the side of individual fringe-pits (Whittington, 1968).
 Although the number of fringe-pits was essentially stable from early meraspis through holaspis, the shape of the cephalon continued to change during later ontogeny (Figure 6). In particular, the overall convexity in the fringe, and thus the cephalon, increased throughout ontogeny (Figure 5). The chamber created by the fringe had an increasingly greater height in the posterior part of the cephalon and the median arch became more pronounced during growth. Shape change in the glabella was similar to that of the entire cephalon, but generally to a smaller degree. For example, the glabella became longer relative to width during growth, but the increase in the convexity was much smaller. Thus accommodation of organs and muscles under the glabella during growth required increase in size, but less so change in shape. Because both upper and lower lamellae increased in convexity, the change in the convexity of the cephalon resulted in a relative increase in the size of the open “chamber” underneath the ventral size of the organism.
Implications for Paleoecology of Cryptolithus tesselatus
The change in the convexity of the cephalon has implications for changes in functional morphology during the ontogeny of Cryptolithus tesselatus. For example, previous authors have speculated that the fringe served as a filter aiding in capturing suspended food particles (Begg, 1944; Seilacher, 1970; Bergström, 1972; Cisne, 1973; Fortey and Owens, 1999). The proposed orientation of the organism during filter feeding (Fortey and Owens, 1999, text-figure 16) is based on the shape of the cephalic margin, the orientation of the fringe-pits, and comparison with putatively associated trace fossils (Osgood, 1970; Seilacher, 1970; Campbell, 1975). In such a scenario the convexity of the cephalon is critical for defining a chamber in which particles are being sorted out of the suspended sediment. Based on the 3D morphometric analysis, the shape of the cephalon in juveniles would have been much less conducive to this strategy, and there was an expansion through ontogeny of the surface area exposed to currents (oncoming or generated by the organism).
Other hypotheses for the function of the pitted fringe in trinucleids such as Cryptolithus include ploughing of sediment (Bergström, 1972), burrowing semi-infaunally (Osgood, 1970); housing the digestive system (Campbell, 1975), housing sensillae or a membraneous sensory array (Campbell, 1975), and strengthening of the exoskeleton while keeping it light (Størmer, 1930). We agree with Campbell (1975) that the latter is unlikely, as the presence of the fringe-pits increases the surface area of the exoskeleton, ultimately requiring more biomineralized mass, not less. Nevertheless, CT-scanning of Cryptolithus could be used to test this more rigorously by supplying surface models that could be used to assess changes in mass and surface area throughout ontogeny. Surface models of Cryptolithus as well as other trinucleids could also be used for assessing the potential for filter feeding, including “size-selective feeding” (Cisne, 1973) in trinucleids throughout ontogeny, and for physical and/or virtual experiments in functionality and stability under various water flow conditions.
Is 3D Morphometrics Necessary for Highly Convex Trilobites?
 Although there are clearly features of ontogenetic shape change that would not be captured by 2D morphometrics of C. tesselatus, it would be useful to know for interpretation of past and future trilobite studies if the rate of shape change shown in Figure 6 is captured by 2D morphometrics taken from a dorsal view of the cephalon. In order to determine this, we digitized the 18 fixed landmarks visible in dorsal view and semi-landmarks along the first internal list from photographs of the same 23 specimens in dorsal view (Figure 9.1). To the extent possible, the chosen landmarks replicate the landmarks selected from the dorsal surface of the 3D models. However, as mentioned in the Methods section, the landmarks that represent some features are by necessity placed in slightly different positions--most notably landmarks can be chosen from the photographs that represent cavities (the dorsal pits). Thus the landmarks selected from the photographs are an approximate subset of the 3D landmarks. For the model comparison, the natural log of centroid size at the corresponding breakpoints were 2.2 and 3.2.
Results show that, as with the 3D analysis, the first PC axis is dominated by shape change associated with size (Figure 9.2). More importantly, decrease in the rate of ontogenetic shape change estimated from the 2D landmark dataset is approximately the same as that estimated from the 3D landmark dataset: the threshold model with a single early breakpoint is best supported, and at this point, the slope decreases by about half (compare Figure 6 with Figure 9.3). It appears that this is due to the strong correlation of change in the convexity of the cephalon with change in the shape of the cephalon in dorsal view (from semi-elliptical to semi-circular). The correlation between different aspects of shape change means that estimates of rate of shape change are consistent across different morphological datasets. Although we caution that these results may be particular to C. tesselatus, this is good news for anyone interested in calculating rates of shape change in other highly convex trilobite species as the collection of 2D landmarks is less time-intensive and less technologically demanding than the collection of 3D landmarks, even by the methods taken in this study.
Comparison of Cryptolithus tesselatus with Other Trilobite Species
Although ontogenetic descriptions exist for numerous trilobite species, quantitative assessment of rates of shape change are dominated by comparisons of simple length measurements, with fewer leveraging geometric morphometrics to quantify ontogenetic shape change. We found eight papers in which landmark data was used to describe the shape of the cranidium and allometric curves were constructed by plotting the Procrustes distance (or partial Procrustes distance) from the smallest specimens against centroid size (Kim et al., 2002; Delabroye and Crônier, 2008; Hopkins and Webster, 2009; Park and Choi, 2011b; Hong et al., 2014; Park et al., 2014; Park and Kihm, 2015; Webster, 2015). One of these not only described a different fringed trinucleid, Marrolithus bureaui, but also included information about how different stages in the morphological development of the cranidium related to the timing of segment release into the thorax (Delabroye and Crônier, 2008). In M. bureaui, the complete number of six concentric arcs was developed by meraspid stage 4, with only a few fringe-pits added in later stages (presumably stage 5 just preceding holaspis). In order to compare this species with C. tesselatus, we first digitized the ontogenetic curve from this paper using PlotDigitizer (plotdigitizer.sourceforge.net/). We then fitted three threshold models with breakpoints at the size ranges associated with stage 4, stage 5, and the holaspis stage, respectively. We compared these with a threshold model with two breakpoints (stage 4 and holaspis) and a simple linear model using AIC as described above for C. tesselatus. Results were unexpected: in Marrolithus bureaui, a shift in the rate of shape change at the onset of holaspis was much better supported than any of the models that included a shift at preceding developmental stages associated with the cessation of new fringe-pits (Table 2, Figure 10.1).
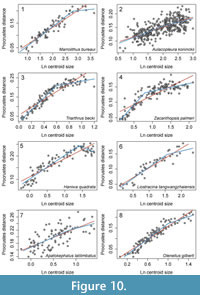 For the other studies, it is possible to set a putative breakpoint for a threshold model based on the size range of the latest developmental stage recognized by the authors of the papers. For all but two of these (Triarthrus becki and Aulacopleura koninckii), it is not known how change in the cranidium relates to the timing of segment release. Nonetheless ontogenetic shape change is frequently better characterized by a threshold model than a simple linear regression model (Table 3). There are two exceptions: Apatokephalus latilimbatus (Figure 10.7), where the linear model is better supported; and Aulacopleura koninckii, (Figure 10.2), where both models share similar support. In both cases, the change in rate implied by the threshold model is very small. In the case of Haniwa quadrata (Figure 10.5), the slope above the breakpoint is actually negative, but this is likely to be due to low sampling of specimens at the breakpoint itself rather than a true reflection of shape change in this species. In the case of Olenellus gilberti (Figure 10.8), data was available from several geometric morphometric analyses that varied in the source locality and taphonomy of the material, the number of developmental stages represented, and the landmarks chosen. Here we applied the model selection to the analysis that comprised the greatest number of developmental stages and set the breakpoint at the size range of specimens unambiguously assigned to the latest developmental stage. However, it is worth noting that because allometric growth is evident in the latest stage, specimens of this species are not considered “morphologically mature” until they have reached the later part of this stage (Webster, 2015).
Because there is so little quantitative data describing overall shape change in species where segmentation patterns have been established, it is difficult to predict the relative frequencies of different modes of ontogeny. However, a few conclusions may be drawn from this study. First, trilobite ontogenetic trajectories which include putative holaspids may often be better characterized by threshold models than the simple linear regression models sometimes applied. Second, the expectation that shifts in the rate of shape change associated with “morphological maturity” are also associated with the cessation of thoracic segment release is belied by the example of Cryptolithus tesselatus. Shifts in the rate of shape change may in fact be associated with other major morphological developments at different ontogenetic stages. However, and finally, the difference between C. tesselatus and M. bureaui in this respect suggests that the timing of such shifts may not be phylogenetically conserved.
ACKNOWLEDGMENTS
Thank you to M. Hill and H. Towbin in the AMNH Microscopy and Imaging Facility for scanning the specimens and providing help with post-processing, to W. Harcourt-Smith for help with Landmark Editor, to G. Edgecombe for discussion about the provenance of the specimens and Cryptolithus ontogeny, to A. Bush for editorial support, and to K. Parsons-Hubbard and two anonymous reviewers for suggestions that improved the manuscript.
REFERENCES
Adams, D.C. and Otarola-Castillo, E. 2013. geomorph: An R package for the collection and analysis of geometric morphometric shape data. Methods in Ecology and Evolution, 4:393-399.
Begg, J.L. 1944. On the fringe of Tretaspis. Geological Magazine, 81:113-117.
Bergström, J. 1972. Appendage morphology of the trilobite Cryptolithus and its implications. Lethaia, 5:85-94.
Burnham, K.P. and Anderson, D.R. 2002. Model Selection and Multimodel Inference, second edition. Springer-Verlag, Inc., New York.
Campbell, K.S.W. 1975. The functional morphology of Cryptolithus. Fossils and Strata, 4:65-86.
Chatterton, B.D.E., Edgecombe, G.D., Speyer, S.E., Hunt, A.S., and Fortey, R.A. 1994. Ontogeny and relationships of Trinucleodea (Trilobita). Journal of Paleontology, 68:523-540.
Chatterton, B.D.E., Siveter, D.J., Edgecombe, G.D., and Hunt, A.S. 1990. Larvae and relationships of the Calymenina (Trilobita). Journal of Paleontology, 64:255-277.
Cisne, J.L. 1973. Beecher's trilobite bed revisited: ecology of an Ordovician deepwater fauna. Postilla, Peabody Museum of Natural History, Yale University, 160:1-25.
Claude, J. 2008. Morphometrics with R. Springer-Verlag, Inc., New York.
Delabroye, A. and Crônier, C. 2008. Ontogeny of an Ordovician trinucleid (Trilobita) from Armorica, France: a morphometric approach. Journal of Paleontology, 82:800-810.
Edgecombe, G.D. 1992. Trilobite phylogeny and the Cambrian-Ordovician "event": cladistic reappraisal, p. 144-177. In Novacek, M.J. and Wheeler, Q.D. (eds.), Extinction and Phylogeny. Columbia University Press, New York.
Fortey, R.A. and Chatterton, B.D.E. 1988. Classification of the trilobite suborder Asaphina. Palaeontology, 31:165-222.
Fortey, R.A. and Owens, R.M. 1999. Feeding habits in trilobites. Palaeontology, 42:429-465.
Fusco, G., Hughes, N.C., Webster, M., and Minelli, A. 2004. Exploring developmental modes in a fossil arthropod: growth and trunk segmentation of the trilobite Aulacopleura konincki. American Naturalist, 163:167-183.
Gerber, S. and Hopkins, M.J. 2011. Mosaic heterochrony and evolutionary modularity: the trilobite genus Zacanthopsis as a case study. Evolution, 65:3241-3252.
Green, J. 1832. A Monograph of the Trilobites of North America: with Colored Models of the Species. Clark & Raser, Printers, Philadephia.
Gunz, P., Mitteroecker, P., Neubauer, S., Weber, G.W., and Bookstein, F.L. 2009. Principles for the virtual reconstruction of hominin crania. Journal of Human Evolution, 57:48-62.
Hong, P.S., Hughes, N.C., and Sheets, H.D. 2014. Size, shape, and systematics of the Silurian trilobite Aulacopleura koninckii. Journal of Paleontology, 88:1120-1138.
Hopkins, M.J. and Webster, M. 2009. Ontogeny and geographic variation of a new species of the corynexochine trilobite Zacanthopsis (Dyeran, Cambrian). Journal of Paleontology, 83:524-547.
Hughes, C.P., Ingham, J.K., and Addison, R. 1975. The morphology, classification and evolution of the Trinucleidae (Trilobita). Philosophical Transactions of the Royal Society of London B: Biological Sciences, 272:537-604.
Kim ,K., Sheets, H.D., Haney, R.A., and Mitchell, C.E. 2002. Morphometric analysis of ontogeny and allometry of the Middle Ordovician trilobite Triarthrus becki. Paleobiology, 28:364-377.
Osgood, R.G. 1970. Trace fossils of the Cincinnati area. Palaeontographica Americana, 6:281-444.
Park, T.-Y. and Choi, D.K. 2011a. Constraints on using ontogenetic data for trilobite phylogeny. Lethaia, 44:250-254.
Park, T.-Y. and Choi, D.K. 2011b. Ontogeny of the Furongian (late Cambrian) remopleuridioid trilobite Haniwa quadrata Kobayashi, 1933, from Korea: implications for trilobite taxonomy. Geological Magazine, 148:288-303.
Park, T.-Y.S. and Kihm, J.-H. 2015. Post-embryonic development of the Early Ordovician (ca. 480 Ma) trilobite Apatokephalus latilimbatus Peng, 1990 and the evolution of metamorphosis. Evolution and Development, 17:289-301.
Park, T.-Y.S., Kihm, J.-H., Kang, I., and Choi, D.K. 2014. Ontogeny of a new species of the Cambrian Series 3 (Middle Cambrian) trilobite genus Liostracina Monke, 1903 from North China and the taxonomic position of the superfamily Trinucleoidea. Journal of Paleontology, 88:395-402.
R Development Core Team. 2015. R: a language and environment for statistical computing. R Foundation for Statistical Computing, Vienna, Austria. https://www.r-project.org/
Seilacher, A. 1970. Cruziana stratigraphy of "non-fossiliferous" Palaeozoic sandstones, p. 447-476. In Crimes, T.P. and Harper, J.C. (eds.), Trace Fossils. Geological Journal Special Issue 3, Seel House Press, Liverpool.
Størmer, L. 1930. Scandinavian Trinucleidae with special reference to Norwegian species and varieties. Norsk Videnskaps-Akademi i Oslo. Skrifter I. Matematisk-Naturvidenskapelig Klasse, 5:1-111.
Webster, M. 2015. Ontogeny and intraspecific variation of the early Cambrian trilobite Olenellus gilberti, with implications for olenelline phylogeny and macroevolutionary trends in phenotypic canalization. Journal of Systematic Palaeontology, 13:1-74.
Whittington, H.B. 1941. The Trinucleidae: with special reference to North American genera and species. Journal of Paleontology, 15:21-41.
Whittington, H.B. 1959. Silicified Middle Ordovician trilobites: Remopleuridae, Trinucleidae, Raphiophoridae, Endymioniidae. Bulletin of the Museum of Comparative Zoology, 121(8):369-496.
Whittington, H.B. 1968. Cryptolithus (Trilobita): Specific characters and occurrences in Ordovician of Eastern North America. Journal of Paleontology, 42:702-714.
Wiley, D.F., Amenta, N., Alcantara, D.A., Ghosh, D., Kil, Y.J., Delson, E., Harcourt-Smith, W., Rohlf, F.J., St. John, K., Hamann, B., Motani, R., Frost, S., Rosenberger, A.L., Tallman, L., Disotell, T., and O'Neill, R. 2007. Landmark Editor ver. 3.6: Institute for Data Analysis and Visualization (IDAV) and the University of California, Davis. www.idav.ucdavis.edu/research/EvoMorph
