FIGURE 1. Left lateral (1), dorsal (2) and ventral (3) views of Phyllopachyceras ezoensis with preserved upper and lower jaws in situ within the body chamber. UMUT MM 27831 (modified from Tanabe et al., 2013).
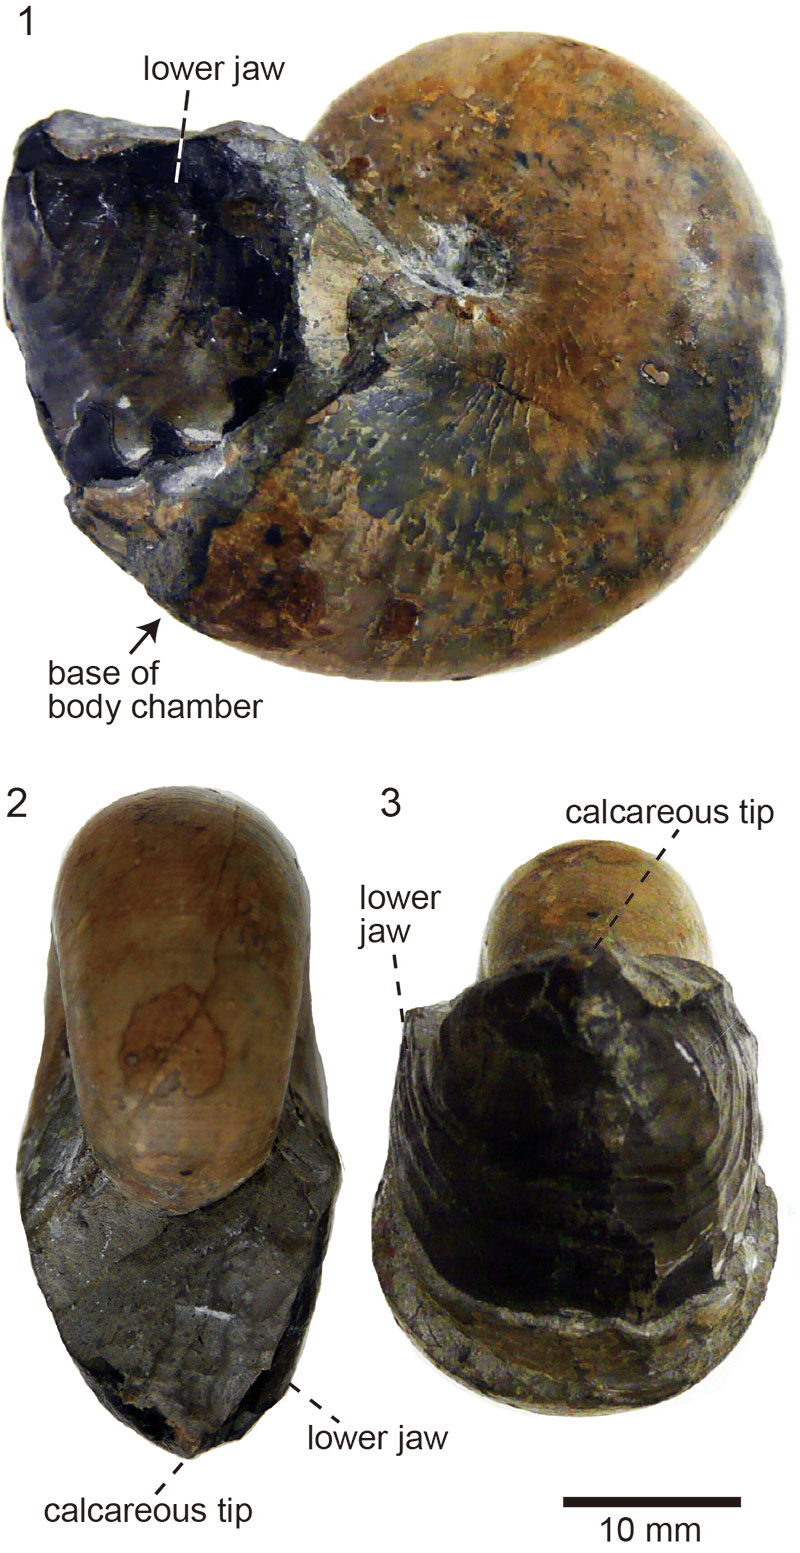
FIGURE 2.Reconstructed tomographic images of the specimen (1) and its internal structure in median section (2). The lower and upper jaws are enlarged in (3) and (4), respectively.
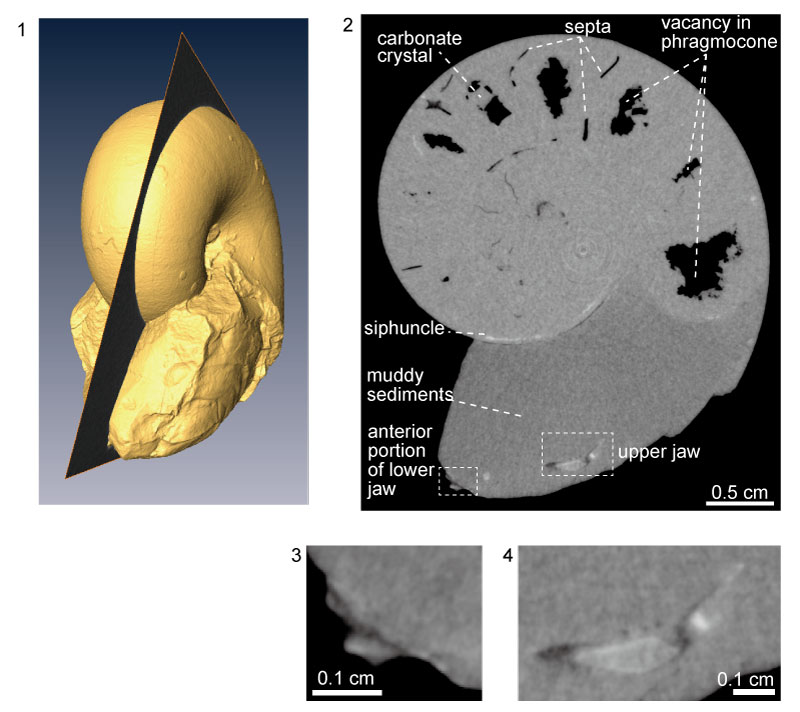
FIGURE 3. Serial cross-sections of the body chamber portion of the specimen cut from the venter (1) to the dorsum (4), in which sectioned images of the upper jaw are shown. Note that the vertical stripes are due to the separated scanning.
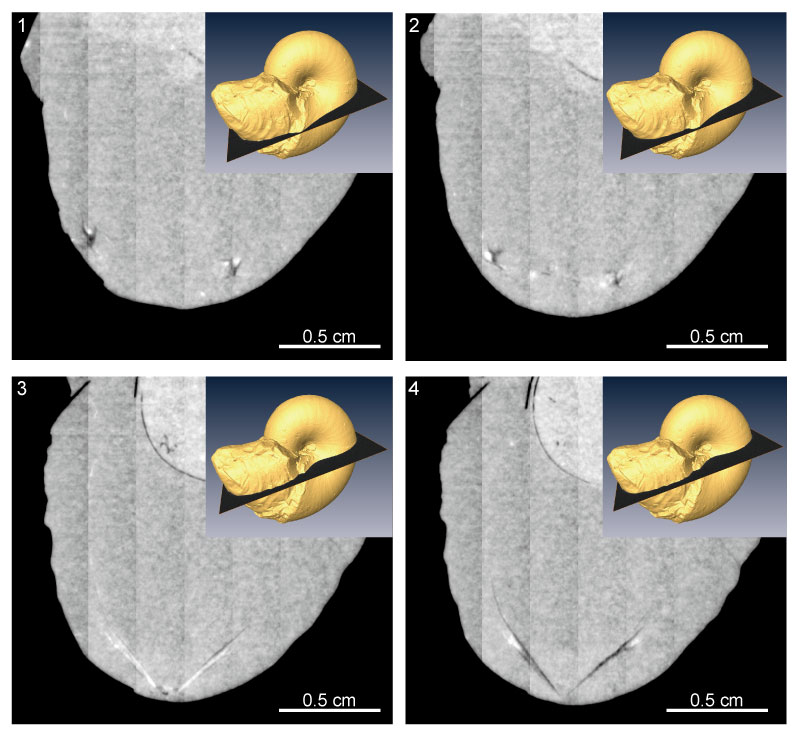
FIGURE 4. Linear absorption coefficient (LAC) of the internal portions of the specimen estimated by their mean luminance values in the tomographic images. The numbers (1)-(10) correspond to the materials in Table 1. The dashed lines indicate the known values for the materials (Chantler et al., 2005) that could be expected to be observed in the specimen. Note that glycine is the most dominant amino acid in jaws of Octopus vulgaris (Hunt and Nixon, 1981). The relationship between LAC values and luminance values is based on the assumption that the LAC values for the surrounding air are zero and that the crystals precipitated in the phragmocone are calcite.
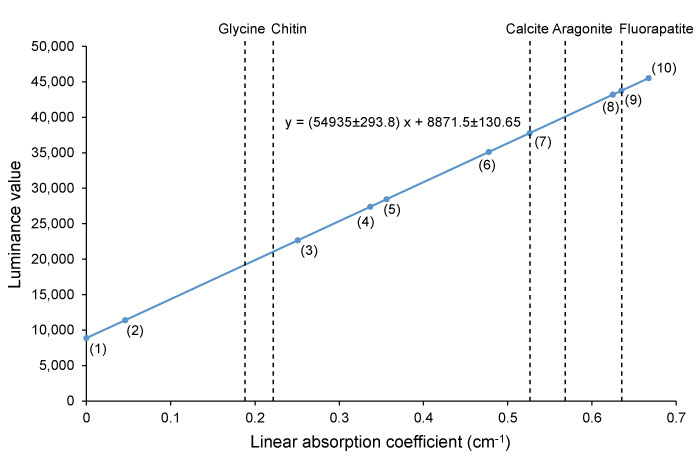
FIGURE 5. Three-dimensional reconstruction of the upper and lower jaws preserved in the body chamber of the specimen. The reconstructed parts are inside the specimen (1). The jaws are preserved close to each other (2).
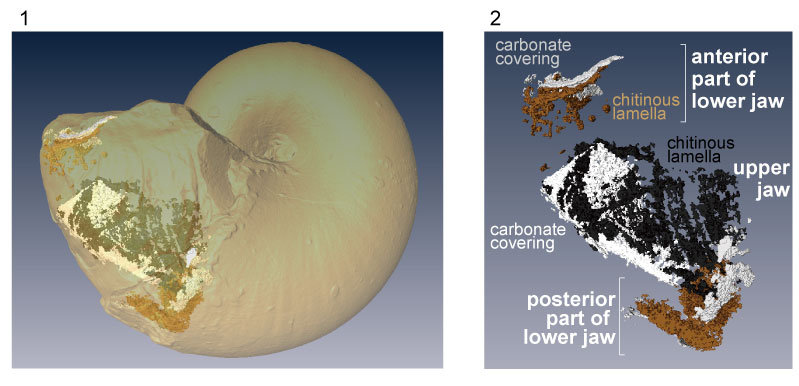
FIGURE 6. Result of segmentation of the lower jaw of the specimen, from lateral view which is restricted to its anterior and posterior portion (1). Three-dimensional reconstruction (2) suggests a wide distribution of calcareous material. The outer calcareous layer on the outer “chitinous” layer is partly taken off in (2). The transverse section of the area indicated as a square in (1) shows that the calcareous covering of the lower jaw also covers the internal surface of the “chitinous” lamella (3). The abbreviation is indicated in (2).
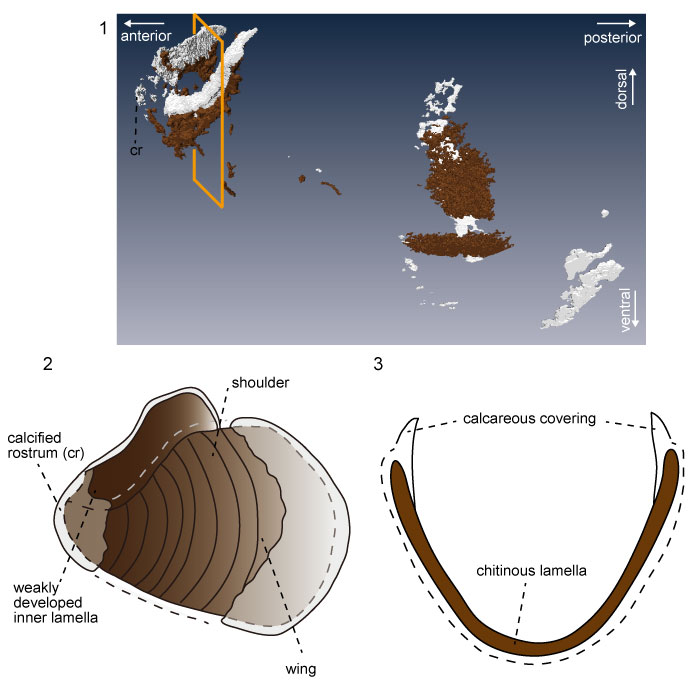
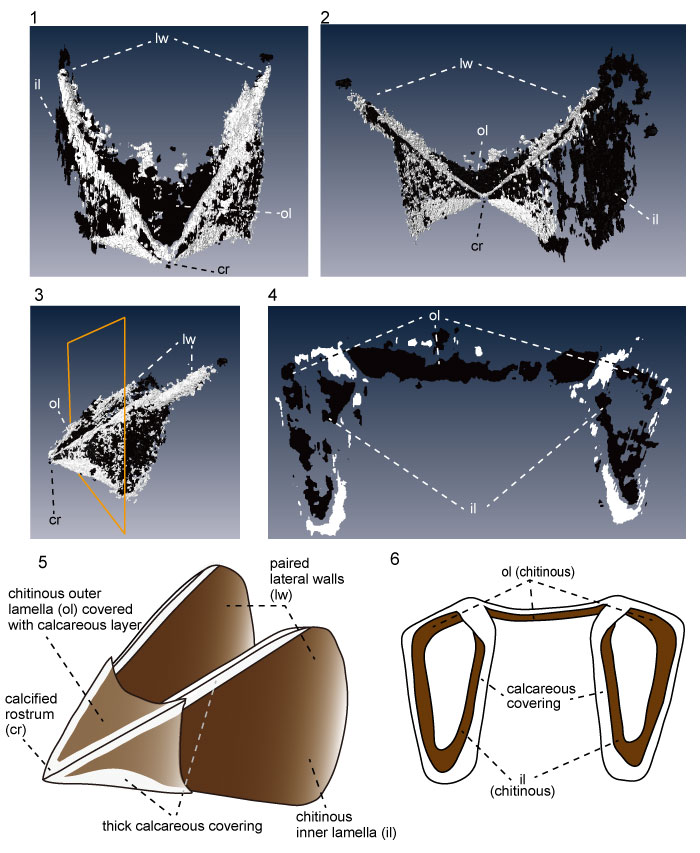
FIGURE 7. Result of segmentation of the upper jaw of the specimen, from frontal (1), rear (2), left-lateral (3) views and the transverse section of the area (4) indicated as a square in (3). The three-dimensional reconstruction (5) shows areal distributions of the “chitinous” lamellae and the calcareous covering. The reconstruction of the transverse section (6), which corresponds to (4), shows the architecture of the outer lamella. The abbreviations are indicated in (5).